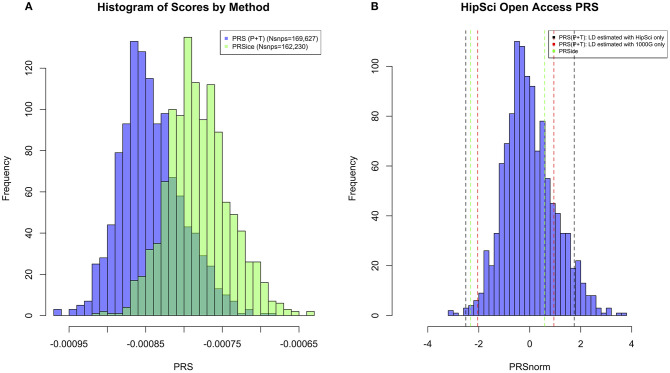
Figure 2.
(A) Histogram of PRS Scores in HipSci (19) open access data + 1,000 Genomes data (18) for both PRS(P+T) and PRSice methods. Only SNPs with p ≤ 0.5 are included in the score, and a clumping threshold of 0.1 was used. (B) Histogram displaying PRS extremes using PRS(P+T) estimating LD in HipSci (19) data. Additional vertical lines display the PRS of the same two individuals when LD is estimated from a different sample, or PRS is computed using a different method.

