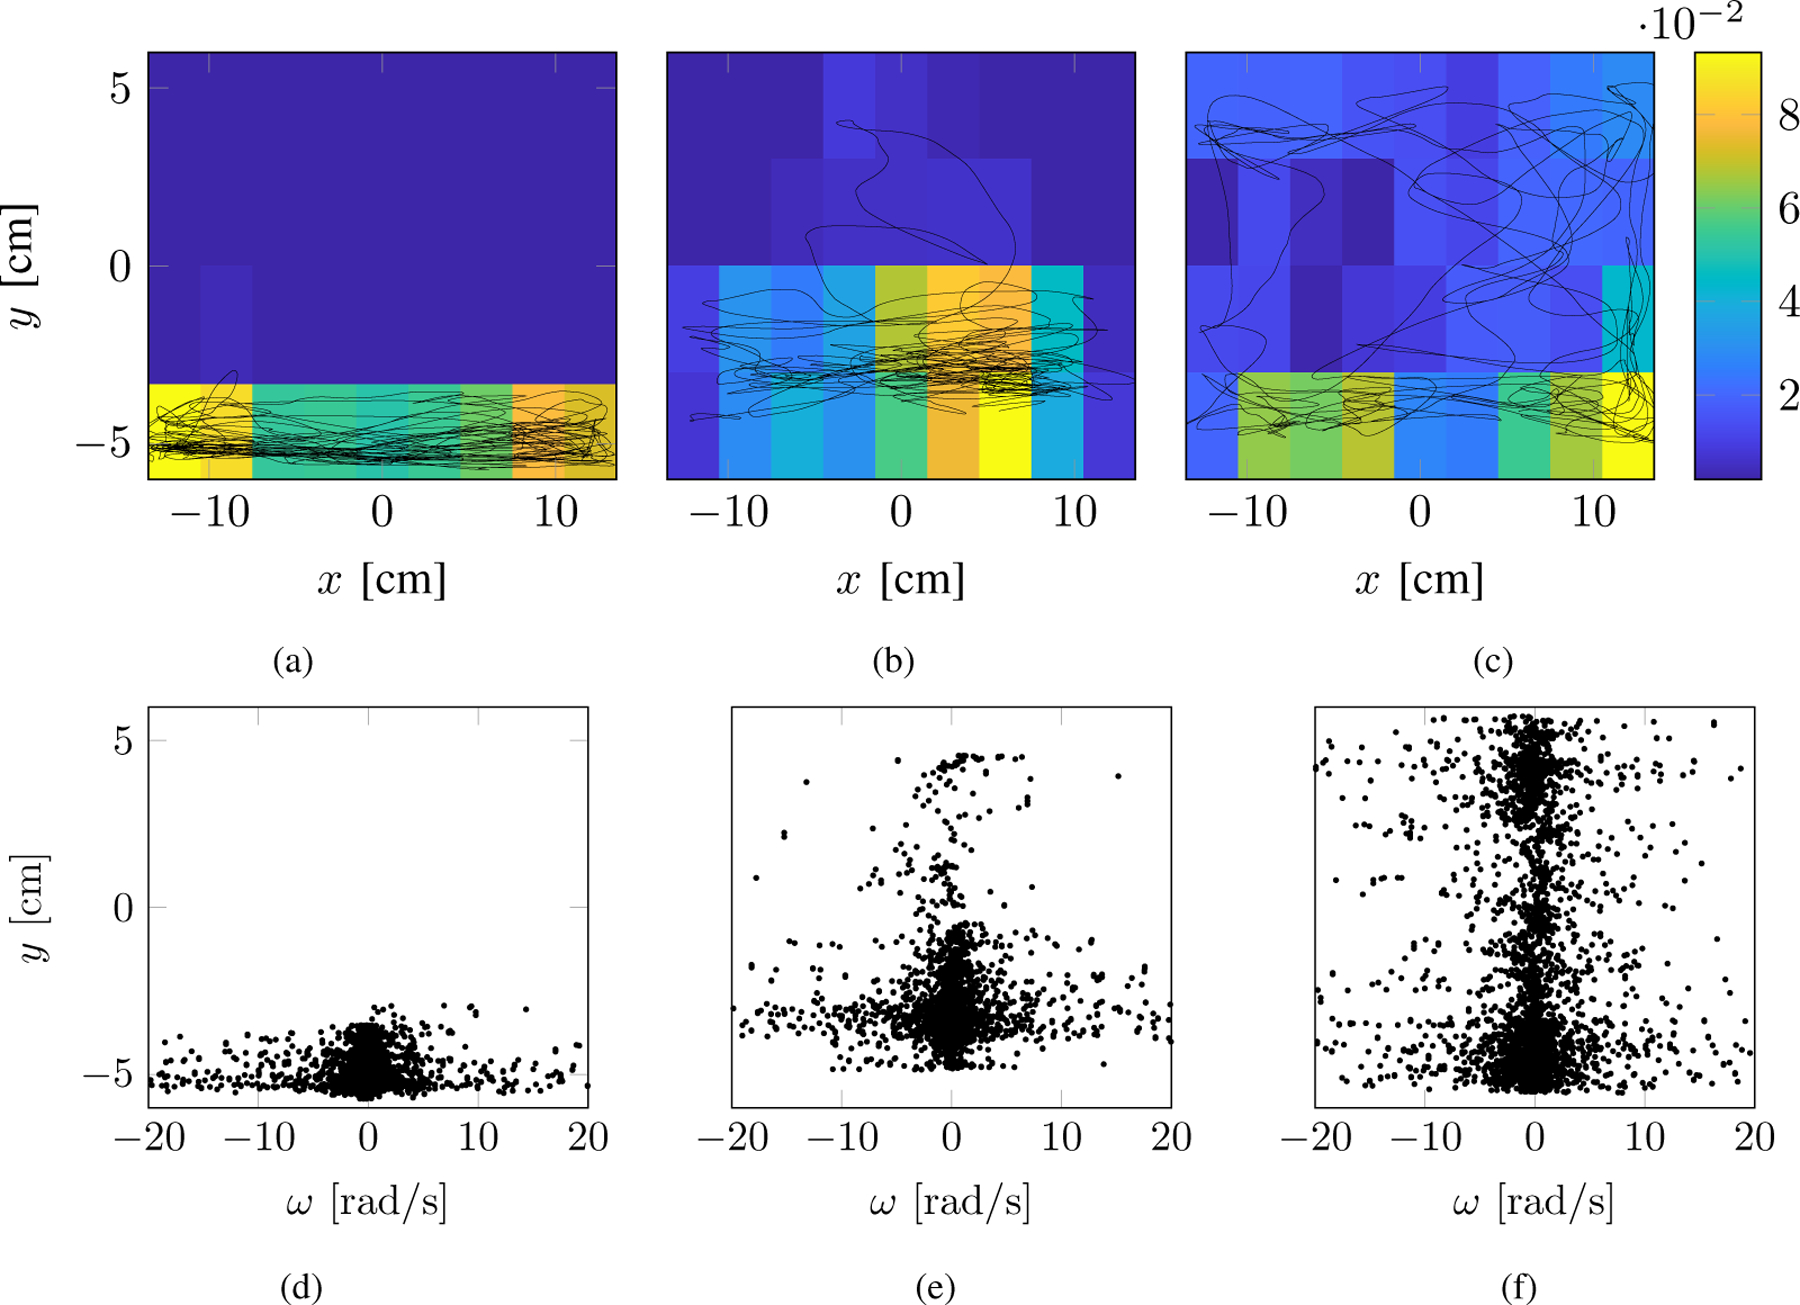
Fig. 2.

Example of geotactic behavior (ID= 15). The first, second, and third columns correspond to the three time windows. Top panels are the swimming trajectories (x(t), y(t)) along with their heat maps representing the frequency of positions in the tank. Blue colors indicate lower preference, while yellow colors identify a higher one. Bottom panels are the turn rate ω(t) along the water column position y(t).
