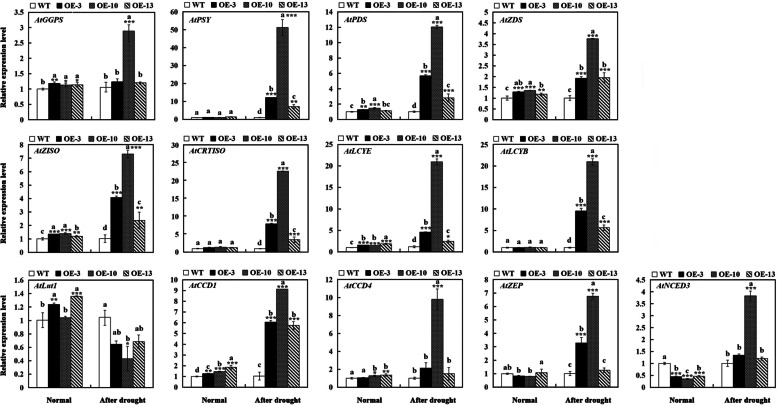
Fig. 7.
Expression patterns of carotenogenic genes in WT and transgenic A. thaliana plants under normal condition and drought stress. Transcript levels of endogenous carotenogenic genes in WT and transgenic A. thaliana (OE-3, OE-10, OE-13) under normal condition and after 15 d of drought treatment. Bars represent mean standard deviation (SD). Asterisks (*) indicate significant differences between transgenic plants (OE-3, OE-10, OE-13) and the WT plants (* P < 0.05; ** P < 0.01; *** P < 0.001). The letters above the bars indicate significant differences between the plant lines at each time point (P < 0.05, according to Tukey’s multiple range test)

