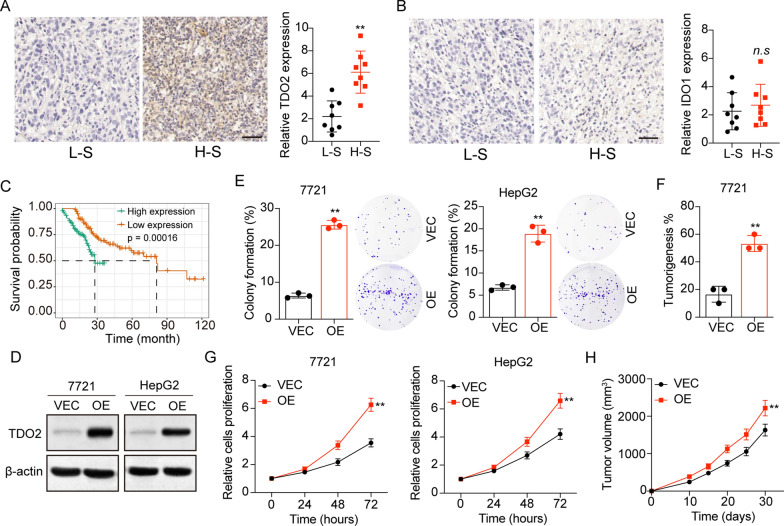
Fig. 1.
TDO2 expression correlated with liver cancer development. A Immunohistochemical staining of TDO2 in high stage (H-S) and low stage (L-S) tumor tissues from liver cancer patients. The intensity of TDO2 expression was calculated in each group (n = 8). The scale bar is 100 μm. B Immunohistochemical staining of IDO1 in high stage (H-S) and low stage (L-S) tumor tissues from liver cancer patients. The intensity of IDO1 expression was calculated in each group (n = 8). The scale bar is 100 μm. C The survival analysis of liver cancer patients divided into high TDO2 expression (n = 134) and low TDO2 expression (n = 136) groups using TCGA database. D Western blotting of TDO2 in SMC-7721/HepG2 and TDO2 overexpression SMC-7721/HepG2 cells. E The colony formation rates of SMC-7721/HepG2 (VEC) and TDO2 overexpression SMC-7721/HepG2 (OE) cells. F The cell proliferation of SMC-7721/HepG2 (VEC) and TDO2 overexpression SMC-7721/HepG2 (OE) cells using CCK-8 analysis. G The tumorigenic capability of SMC-7721 (VEC) and TDO2 overexpression SMC-7721 (OE) cells in immunodeficient mice. H The tumor volume of SMC-7721 (VEC) and TDO2 overexpression SMC-7721 (OE) bearing mice. *p < 0.05, **p < 0.01, n.s, no significant difference

