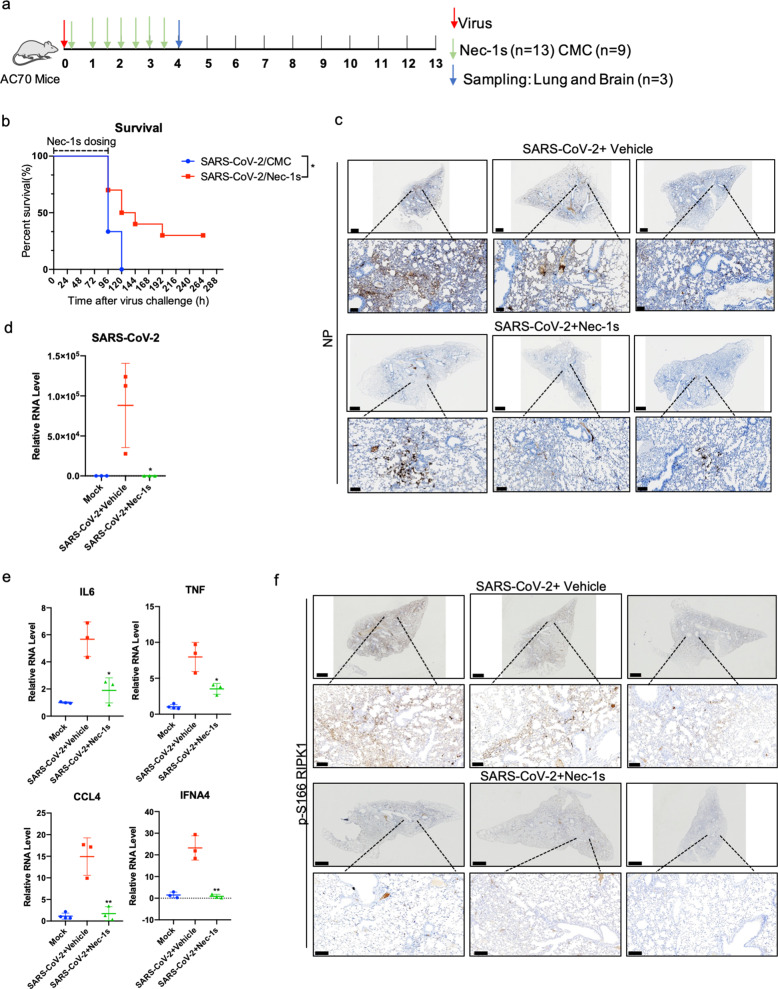
Fig. 5. RIPK1 inhibitor protects CAG-hACE2 transgenic mice (AC70) infected by SARS-CoV-2.
a Experimental design of in vivo study. AC70 transgenic mice (6–8 weeks of age, male) were intranasally infected with 20 μL 1 × 10⁴ TCID50 SARS-CoV-2. Two hours after infection, the mice were intragastrically administered with Nec-1s (n = 13) (50 mg/kg, dissolved in 0.5% Carboxymethyl Cellulose (CMC)) or 0.5% CMC vehicle alone (n = 9), and the dosing was repeated every 12 h. On the day 4 post-infection, 3 mice in each group were sacrificed and their lungs and brains were dissected. The remaining 10 mice in the treatment group (Nec-1s treated for 4 days) and 6 mice in the vehicle group stopped dosing after day 4 and were used to observe the survival rate. b Survival of AC70 transgenic mice after intranasal SARS-CoV-2 infection with intragastric administration of Nec-1s or vehicle. The statistical significance of the survival curve was estimated according to the method of Kaplan and Meier, and the curve was compared with the generalized Wilcoxon test (*P < 0.05). c, d Treatment with Nec-1s inhibits SARS-CoV-2 infection in AC70 transgenic mice. The lungs of mice in the control group and Nec-1s-treated group were fixed and stained for SARS-CoV-2 NP by IHC (c). Scale bars, 900 μm. The lower row shows the enlarged images of specified areas above. Scale bars, 100 μm. Freshly isolated mouse lungs were extracted with Trizol for isolating RNA. After reverse transcription, the virus RNA was analyzed by RT-qPCR (d). Paired t-test was used in RT-qPCR analysis (*P < 0.05). e Treatment with Nec-1s inhibits inflammation in the lungs of AC70 transgenic mice infected with SARS-CoV-2. The lungs of mice in the control group (n = 3) and Nec-1s-treated group (n = 3) were extracted with Trizol, and the expression of cytokines was analyzed by RT-qPCR. Paired t-test was used in RT-qPCR analysis (*P < 0.05, **P < 0.01). f RIPK1 was activated in the lungs of AC70 transgenic mice with SARS-CoV-2 infection. IHC staining of p-S166 RIPK1 in the lungs of control or Nec-1s-administrated AC70 transgenic mice infected with SARS-CoV-2 was shown. Scale bars, 900 μm. The lower row shows the enlarged images of specified areas above. Scale bars, 100 μm.

