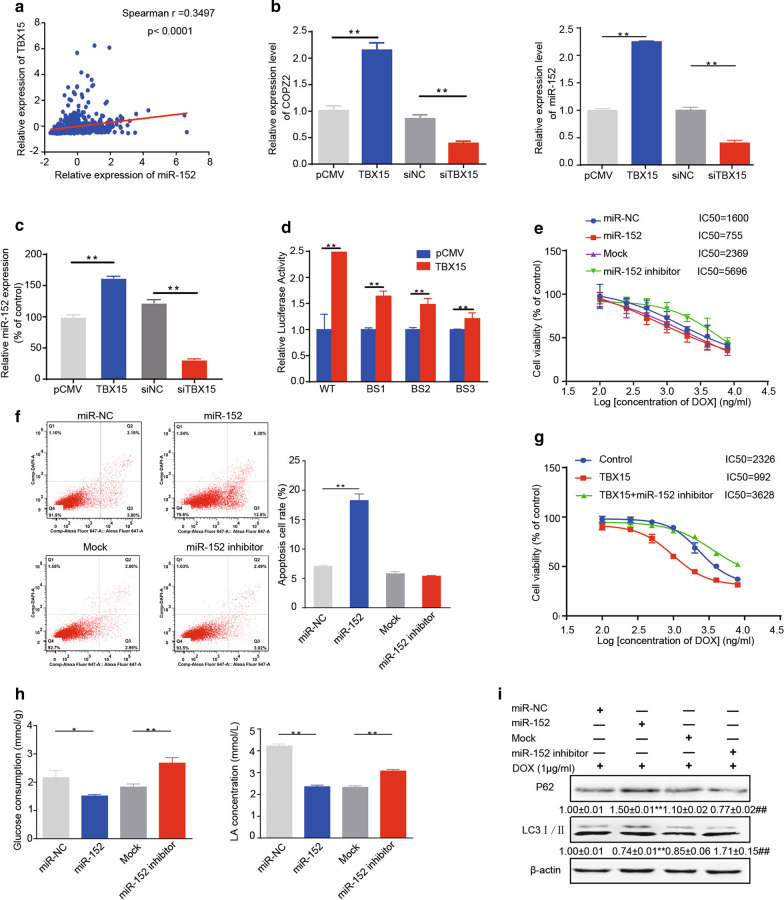
Fig. 2.
TBX15 inhibited DOX resistance in breast cancer through inducing miR-152 expression. A Spearman’s correlation analysis of TBX15 and miR-152 expression in TCGA dataset. B MCF7/ADR cells were treated with TBX15 overexpression or siTBX15, and the expression levels of miR-152 and its host gene were analyzed by qRT-PCR. C T47D/ADR cells were treated with TBX15 overexpression or siTBX15, and miR-152 expression level was analyzed by qRT-PCR. D The luciferase activity was analyzed using Promega Dual-Luciferase Reporter Assay System. The wild type of miR-152 promoter region is located in-320–1800 bp. Three TBX15 binding site sequences: BS1 is located in-322–381 bp, BS2 in -1017–1212 bp, and BS3 in-1536–1793 bp. Three TBX15 binding site sequences in the miR-152 promoter region were cloned into the luciferase reporter vectors. HEK293T cells were co-transfected with TBX15 expression vector (WT) or mutative vectors and a renilla luciferase vector. E MCF7/ADR Cells transfected with miR-152 mimics or miR-152 inhibitor were treated with DOX for 48 h, and subsequently added with MTT and obtain IC50 values. F Flow cytometric plots of MCF7/ADR cells that were transfected as in E and were treated with 1 µg/ml DOX. Cells were harvested after 48 h to assess apoptosis. G Drug sensitivity was analyzed from the cells that were treated with TBX15 overexpression and miR-152 inhibitor. H Glucose consumption (left) and lactate acid concentrations in the medium (right) were tested in MCF7/ADR cells transfected as in E. I Expression levels of LC3II/I and p62 were analyzed by Western blotting with β-actin used as an internal control in cells transfected as in E. For all panels, data are presented as the means ± SEM from three independent experiments. ** Indicates significant difference compared to miR-NC group at P <0.01. ## indicates significant difference compared to mock group at P < 0.01

