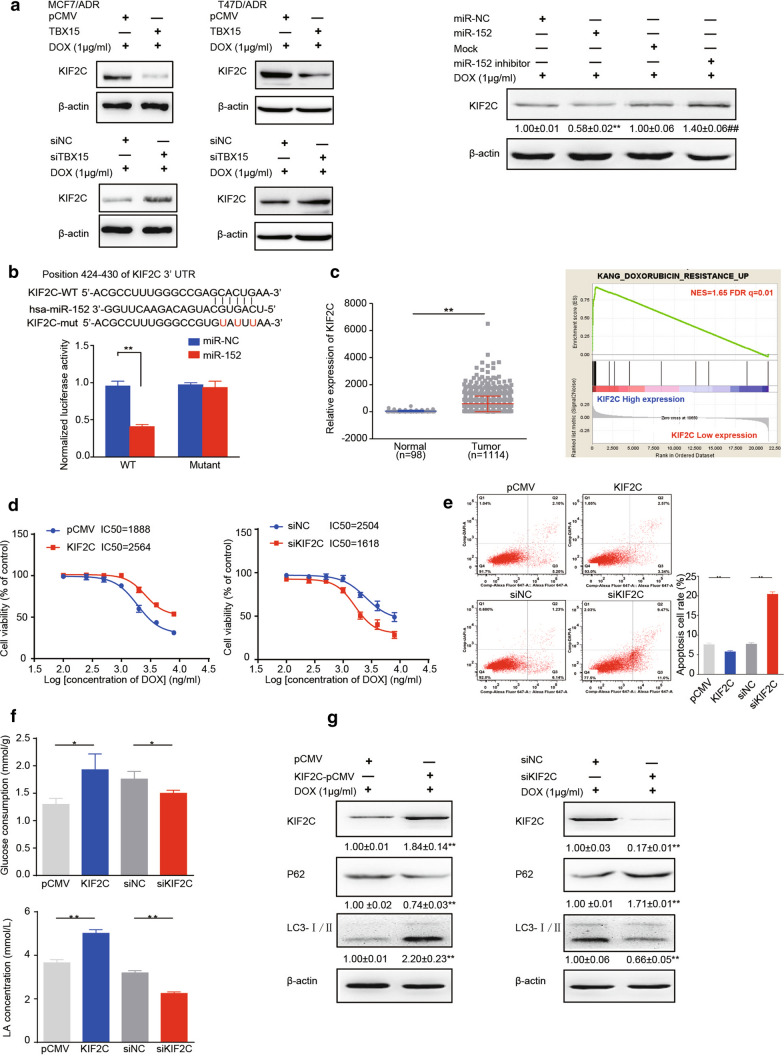
Fig. 3.
TBX15/miR-152 pathway directly targets and inhibits KIF2C. A Western blotting analysis for protein expression of KIF2C in MCF7/ADR cells and T47D/ADR cells transfected with miR-152 mimics or miR-152 inhibitor, or TBX15-pCMV or siTBX15. All cell groups were treated with 1 µg/ml DOX. B Putative seed-matching sites or mutant sites (red) between miR-152 and the 3’-UTR of KIF2C were analyzed by TargetScan. The WT and mutant (mut) binding site sequences of miR-152 in the 3’ UTR of KIF2C were cloned into luciferase reporter vectors. HEK293T cells were co-transfected with the reporter vectors, renilla luciferase vector, and miR-152 mimics or miR-NC. After 24 h, the relative levels of luciferase activity were analyzed and normalized to values obtained from WT cells transfected with miR-NC. C Relative expression levels of KIF2C from normal tissue and breast tumors from human patients. KIF2C mRNA expression data were obtained from TCGA database containing 1114 breast tumors and 98 normal adjacent tissues, and were presented as the means ± SEM from three independent experiments. GSEA analysis to evaluate the correlation between expression levels of KIF2C and DOX resistance signatures in the GEO database. D MCF7/ADR cells were transfected with pCMV or KIF2C-pCMV plasmids (KIF2C), siNC or siKIF2C and were treated with DOX. After 48 h, drug sensitivity analysis was determined. E Flow cytometric analysis of MCF7/ADR cells which were transfected as in D and treated with 1 µg/ml DOX. F, G MCF7/ADR cells were transfected as above and were treated with 1 µg/ml DOX. After 48 h, the glucose consumption (F, top), LA production (F, bottom), and protein expression levels of KIF2C, p62, LC3, β-actin (G) were analyzed. All the data are presented as the means±SEM from three independent experiments and were normalized with corresponding control. *, ** P < 0.05 and P < 0.01, respectively

