Fig. 5.
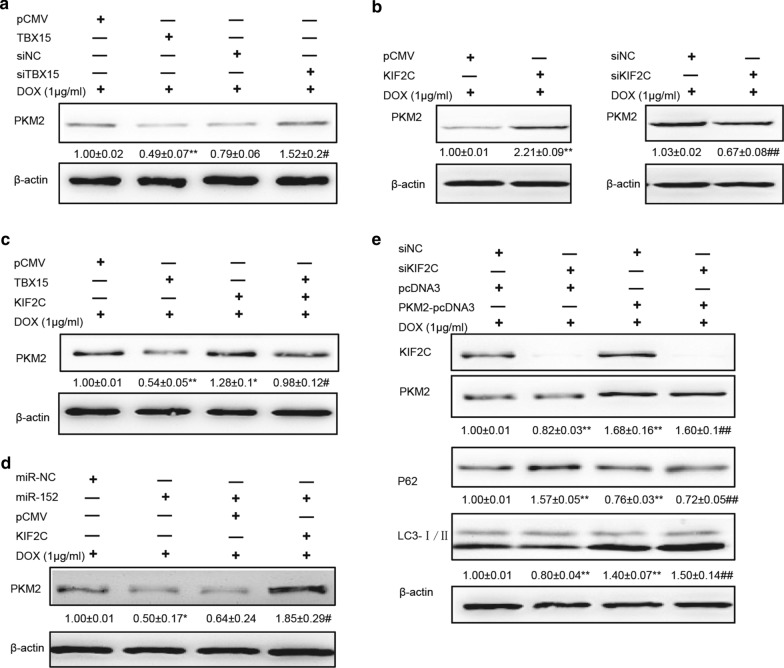
PKM2 is involved in DOX resistance in breast cancer, mediated by the miR-152/KIF2C signaling pathway. A Western blotting analysis of PKM2 levels in MCF7/ADR cells that were transfected with pCMV, TBX15, siNC or siTBX15, and were treated with 1 µg/ml DOX for 48 h. β-actin served as an internal control. B Western blotting analysis of PKM2 levels in MCF7/ADR cells transfected with KIF2C or siKIF2C, and were treated with 1 µg/ml DOX for 48 h. A, B Graph represents the relative density of PKM2 expression. β-actin was used as an internal control. The data are presented as the means ± SEM from three independent experiments.** Indicates significant difference compared to pCMV group at P < 0.01, #,## compared to siNC at P < 0.05, P < 0.01, respectively. C Western blotting analysis of PKM2 levels in MCF7/ADR cells transfected with TBX15 and /or KIF2C, and were treated with 1 µg/ml DOX for 48 h. β-actin was used as an internal control. Graph represents the relative density of PKM2 expression. *,** Indicate significant difference compared to pCMV group at P < 0.05 and P < 0.01, respectively. # Compared to TBX15 at P < 0.05. D Western blotting analysis of PKM2 in MCF7/ADR cells that were co-transfected with miR-NC, miR-152 or KIF2C and were treated with 1 µg/ml DOX for 48 h. β-actin was used as an internal control. * Indicates significant difference compared to miR-NC group at P < 0.05, # compared to miR-152 at P < 0.05. E Western blotting analysis of KIF2C and PKM2 in MCF7/ADR cells that were co-transfected with siNC, siKIF2C or PKM2-pcDNA, and were treated with 1 µg/ml DOX for 48 h. Graph represents the relative density levels of PKM2, p62, or LC3-II/ I expression. β-actin was used as an internal control. ** Indicates significant difference compared to siNC group at P < 0.01, ## compared to siKIF2C at P < 0.01

