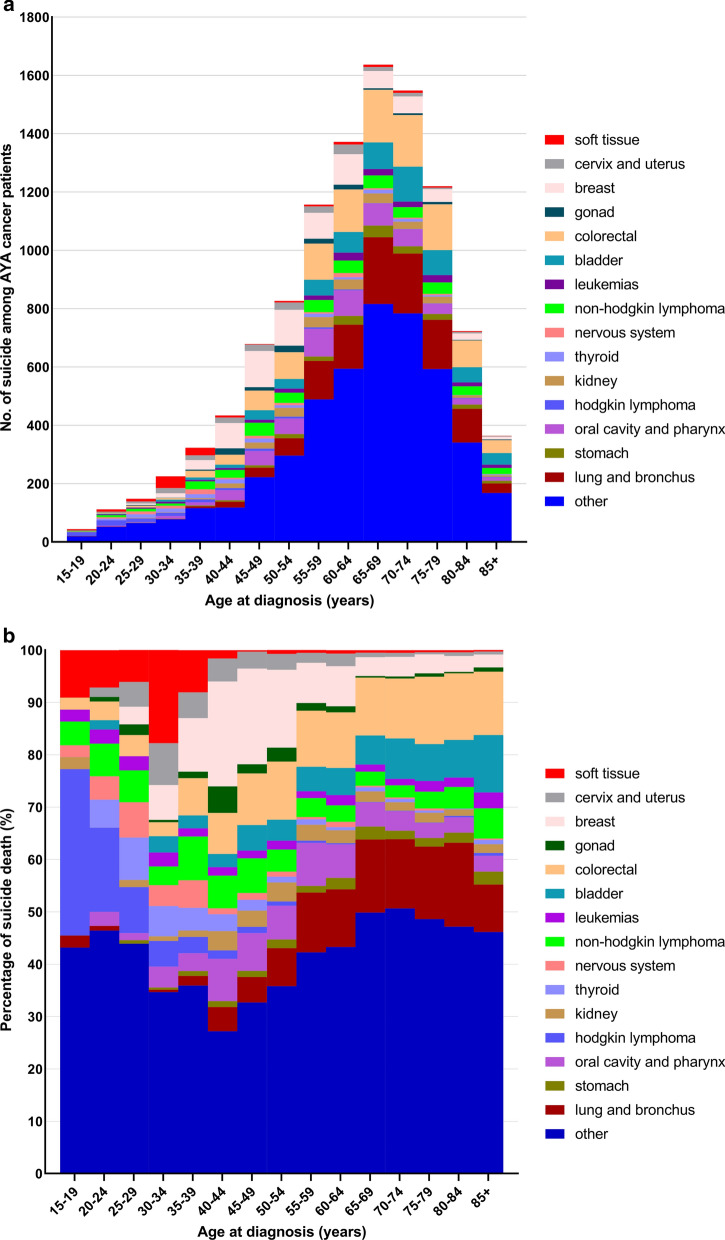
Fig. 2.
Distribution of suicides in cancer type among cancer patients as a function of age group. a The y-axis depicts the relative number of suicides compared to all cancer patients, and the x-axis depicts the age group at time of diagnosis. The colors depict the disease sites. For AYA patients, the plurality of suicides is seen in soft tissue cancer, and lymphoma. In contrast, among older adults (≥ 40 years old), the plurality of suicides occurs in patients with cancer of breast, lung and brounchs, and colorectum. b The y-axis depicts the absolute number of suicides and the x-axis depicts the age group at time of diagnosis. The colors depict the disease sites. The majority of suicide events are in patients diagnosed at an older age (≥ 40 years old), because most cancer patients are middle-aged and elderly

