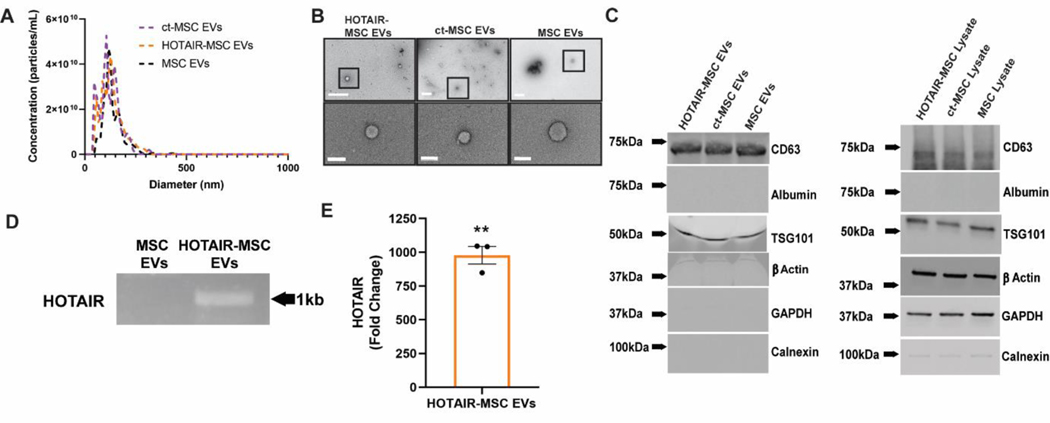
Figure 1. EV characterization and HOTAIR loading confirmation.
(A) Nanotracking analysis of HOTAIR-transfected MSC EVs, control-transfected (ct)-MSC EVs, and native MSC EVs. (B) Transmission electron microscopy (TEM) of the same groups reveal characteristic EV morphology (top row, scale bar = 500nm; bottom row, scale bar = 100nm). (C) Immunoblots of EV-associated markers as well as endoplasmic reticulum (ER) marker (calnexin), serum transport protein albumin, β-Actin, and GAPDH as controls. (D) Gel electrophoresis of a PCR reaction of a 1kb region of HOTAIR-MSC EVs and native MSC EVs from cDNA constructed from EV RNA. (E) Quantification of HOTAIR in HOTAIR-loaded MSC EVs by RT-qPCR compared to ct-MSC EVs. Statistical significance was calculated using one sample t test with hypothetical value equal to 0 (** p<0.01,) (n=3).

