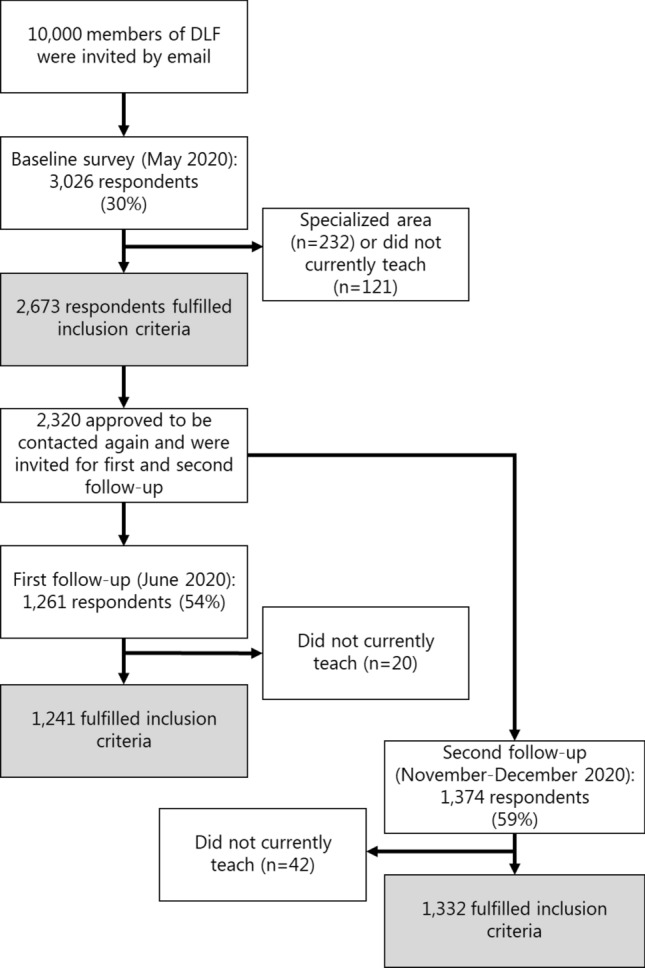
Fig. 2.

Flow diagram of the participation in each survey (baseline, first and second follow-up). The analytical samples were as follows: Baseline n = 2665, first follow-up n = 1239, second follow-up n = 1329, and available data from all three surveys n = 871
