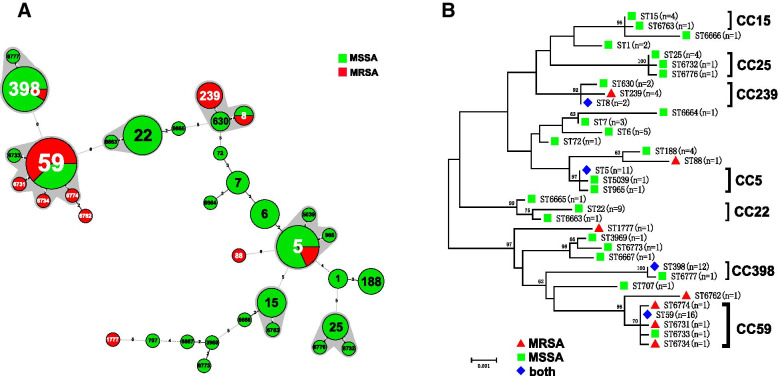
Fig. 1.
Phylogenetic and population structure analysis of Staphylococcus aureus isolates. A Minimum-spanning tree of 101 S. aureus isolates from blood based on MLST. Each ST is represented by a circle sized in proportion to the number of isolates represented by that ST. The gray shaded areas surrounding the STs denote types that belong to the same CC. The number of allelic differences between STs is indicated on the branches. MRSA isolates are represented by red color while MSSA isolates are represented by green color. The detailed MLST profiles can be seen in the Additional file 2. B The maximum likelihood tree of 101 S. aureus isolates for MLST typing. The maximum likelihood tree was constructed based on the seven combined housekeeping genes sequences. Bootstrap support was based on 1000 replicates, and only branch nodes higher than 60 were shown

