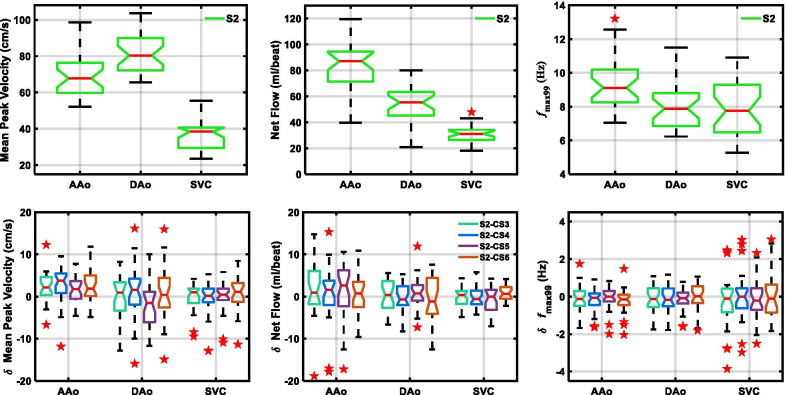
Fig. 3.
Tukey box plots of mean peak velocity (left), net flow (center), and fmax99 (right) values obtained using SENSE = 2 PC-CMR (top row) and differences in those values obtained using four C-SENSE PC-CMR acquisitions (bottom row) for the three vessels evaluated. Horizontal red line = median, whiskers = minimum and maximum within 1.5 times interquartile distance, red star = outliers beyond 1.5 times the interquartile distance. For absolute values (top row), non-overlapping notches indicate that the medians of the two groups differ at the 5% significance level. For difference in values (bottom row), notches excluding zero indicate that there is non-zero bias at 5% significance level between two measurements. δ difference in values, AAo ascending aorta, CS3, CS4, CS5, CS6 C-SENSE acceleration factor of 3,4,5,6, DAo descending aorta, fmax99 frequency below which 99% of the total signal energy of the waveform is contained, LV left ventricle, S2 SENSE acceleration factor of 2, SVC superior vena cava

