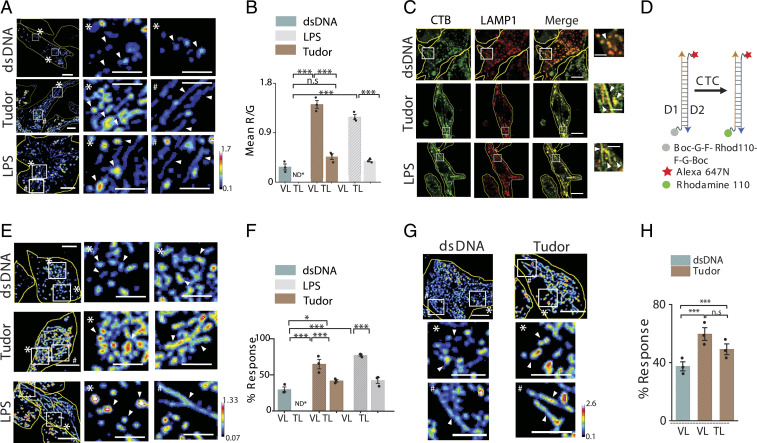
Fig. 3.
Enzymatic cleavage maps show low degradation in TLs. (A) Pseudocolor R/G images of Alexa 488 dextran- (G) and DQ Red BSA- (R) labeled lysosomes in dsDNA, Tudor, or LPS-treated RAW 264.7 cells (Left). White boxes are magnified (Right). (B) Mean R/G ratios of single lysosomes in A (N = 50 cells; n = 200 lysosomes). (C) RAW 264.7 cells immunostained for CTB (green) and LAMP1 (red) upon treatment with dsDNA, Tudor, or LPS. White boxes are magnified (Right). (D) A DNA-based CTC activity reporter consisting of DNA duplex with sensing module (caged Rhodamine 110, gray), normalizing module (Alexa 647N, red), and cleaved module (Rhodamine 110, green). (E) Pseudocolored G/R images of CTC activity reporter in RAW 264.7 cells pretreated with dsDNA, Tudor, or LPS (Left). White boxes are magnified (Right). (F) Percent response of CTC reporter in VLs and TLs in dsDNA-, Tudor-, and LPS-treated cells (N = 50 cells, n = 500 lysosomes). (G) Pseudocolored G/R images of CTC activity reporter in labeled BMDMs (M0) pretreated with dsDNA or Tudor (Top). White boxes are magnified below. (H) Percent response in VLs and TLs of dsDNA- and Tudor-treated cells (N = 50, n = 500 lysosomes), *P < 0.05; ***P < 0.0005. ND*: not defined; n.s: nonsignificant. White arrowheads show VLs (*) and TLs (#). (Scale bars, 10 μm; zoomed scale bars, 2 μm.)

