Fig. 5.
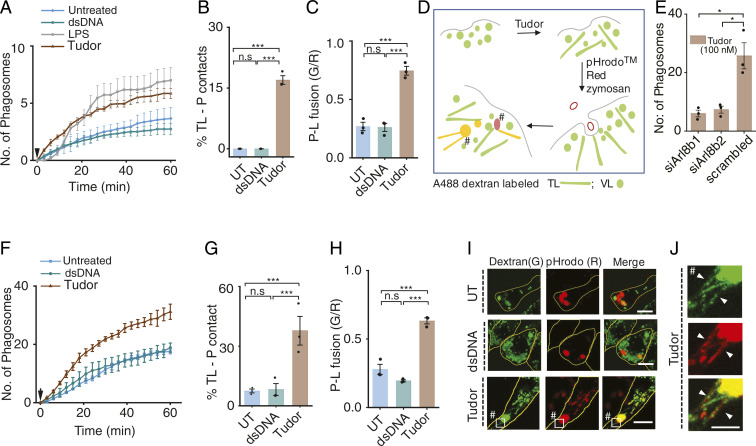
Tubulation promotes phagocytosis and phagosome–lysosome fusion in macrophages. (A) Average number of phagosomes versus time in RAW 264.7 cells treated with dsDNA, LPS, or Tudor. Arrow shows zymosan addition (N = 30 cells). (B) Percentage TLs contacting phagosomes (% TL-P contact) (N = 50 cells,). (C) Phagosome–lysosome fusion (P-L fusion) given by mean G/R value in RAW 264.7 cells (n = 60 cells). (D) Schematic of fusion assay in Tudor-treated cells where lysosomes and phagosomes are labeled with Alexa 488 dextran (G) and pHrodo Red zymosan (R), respectively. (E) Number of phagosomes in Tudor-treated RAW 264.7 cells depleted of Arl8b (N = 100 cells). (F) Average number of phagosomes versus time in Pmac (M0) treated with dsDNA, Tudor, or LPS. Arrow shows zymosan addition (N = ∼30 cells). (G) Percentage TLs contacting phagosomes in M0 Pmacs (n = 30 cells). (H) Extent of phagosome lysosome fusion (P-L fusion) (N = 30 cells). (I) Lysosomes (G) and phagocytosed zymosan particles (R) with or without dsDNA or Tudor treatment in RAW 264.7 cells (J) Inset of TLs-P contacts indicated by #. ***P < 0.0005; *P < 0.05 (one-way ANOVA with Tukey post hoc test). n.s: nonsignificant; n = 100 phagosomes wherever mentioned.

