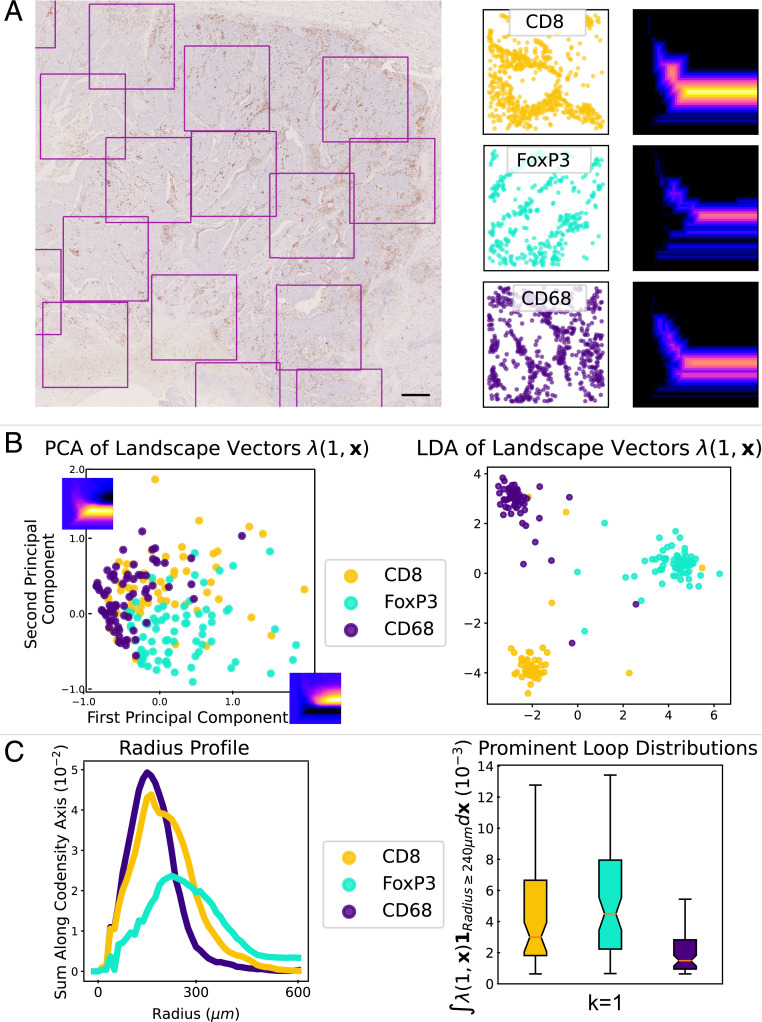
Fig. 3.
TDA of CD8+, FoxP3+, and CD68+ cell spatial patterning in 1.5 mm 1.5 mm tumor regions. (A) A region of a head and neck tumor IHC slide stained to show CD8+ T cells. (Scale bar 500 m.) 1.5 mm 1.5 mm regions of interest are highlighted. In this tumor, sufficient tissue was present to sample 67 regions stained for CD8+ T cells, 74 regions stained for FoxP3+ T cells, and 74 regions stained for CD68+ macrophages. For each region of interest we extract a point cloud of immune cell locations. We plot example point clouds and their associated first multiparameter MPH landscape, , for the radius-codensity filtration. (B) We compute the MPH landscapes for the radius-codensity filtrations associated to each sample. Treating the persistence landscapes as feature vectors we apply PCA to identify the principal difference between the landscapes of the CD8+, FoxP3+, and CD68+ samples. The first and second principal components are plotted on the PCA plot axes. We observe that the T cell samples support loops at large radius parameter values. We use LDA as another dimension reduction technique to visualize the distribution of the landscape vectors and see that the landscape vectors of the three immune cell types can be well separated with a linear classifier. (C) We indicate the prevalence of loops for different radius parameters. We sum the average MPH landscapes along the codensity parameter, , to produce radius profile curves for each immune cell type. Again this indicates that the T cell samples support loops with larger radius parameter than the macrophages. We convert the collections of MPH landscapes to real values which detect loops of large radius parameter, by integrating the landscapes over the parameter values with : .

