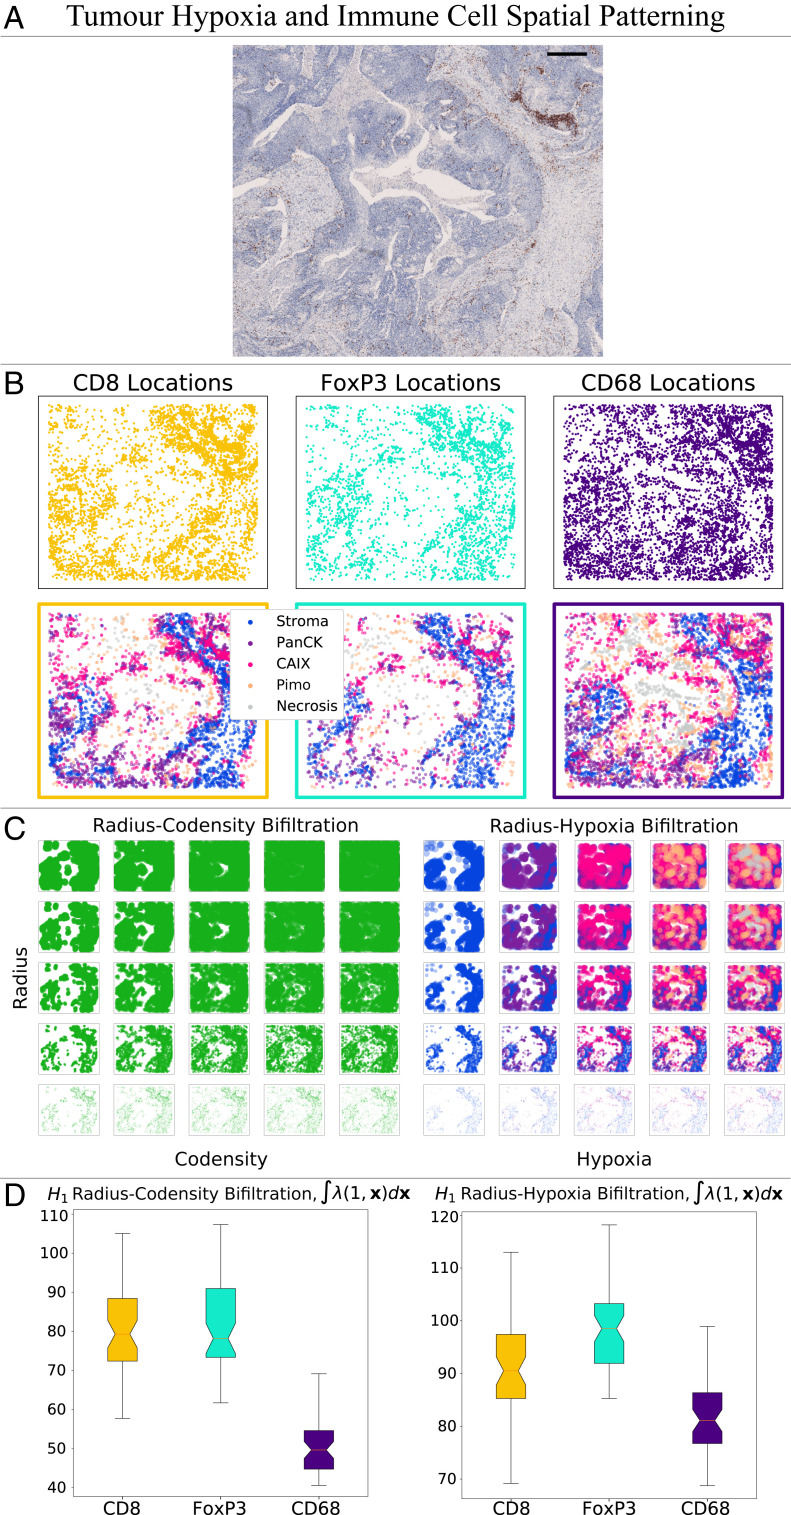
Fig. 4.
We investigate the distribution of immune cells relative to regions of tumor hypoxia, and compare radius-codensity against radius-hypoxia bifiltrations. (A) IHC slide showing CD8+ T cells in a head and neck tumor. The region contains a central area of necrosis annotated by a pathologist. Consecutive IHC regions stained for FoxP3+ T cells, CD68+ macrophages, PanCK (a marker distinguishing tumor from stroma), CAIX (a marker for hypoxia), and Pimo (a marker for more severe hypoxia) were manually aligned. (Scale bar: 500 m, region size 4.72 mm 3.96 mm.) (B) Point clouds of CD8+, CD68+, and FoxP3+ cells are identified from the regions of interest and colored according to which of five distinct tissue regions they lie in: necrosis (identified via manual annotation), Pimo+ (severe hypoxia, identified via positive pimonidazole staining), CAIX+ (less extreme hypoxia, identified via positive CAIX staining and negative pimonidazole staining), PanCK+ (better oxygenated tumor, identified via positive PanCK staining and negative CAIX and pimonidazole staining), and stroma (PanCK negative tissue). (C) This illustrates the similarity between the radius-codensity and the radius-hypoxia bifiltration of one subsample of 1,500 FoxP3+ cells from this region. (D) To examine the distribution of all three immune cell types in detail we repeatedly sample from the large point cloud of cells surrounding the necrotic region. Taking 50 samples we compare the norm of the MPH landscapes for the radius-codensity bifiltration and the radius-hypoxia bifiltration. The results indicate that these two filtrations give comparable relative values for all three cell types. The radius-codensity and radius-hypoxia bifiltrations both indicate that CD68+ cells infiltrate hypoxic regions to a greater extent than CD8+ and FoxP3+ cells. The data suggest that this cell codensity descriptor is a good proxy for hypoxia level.

