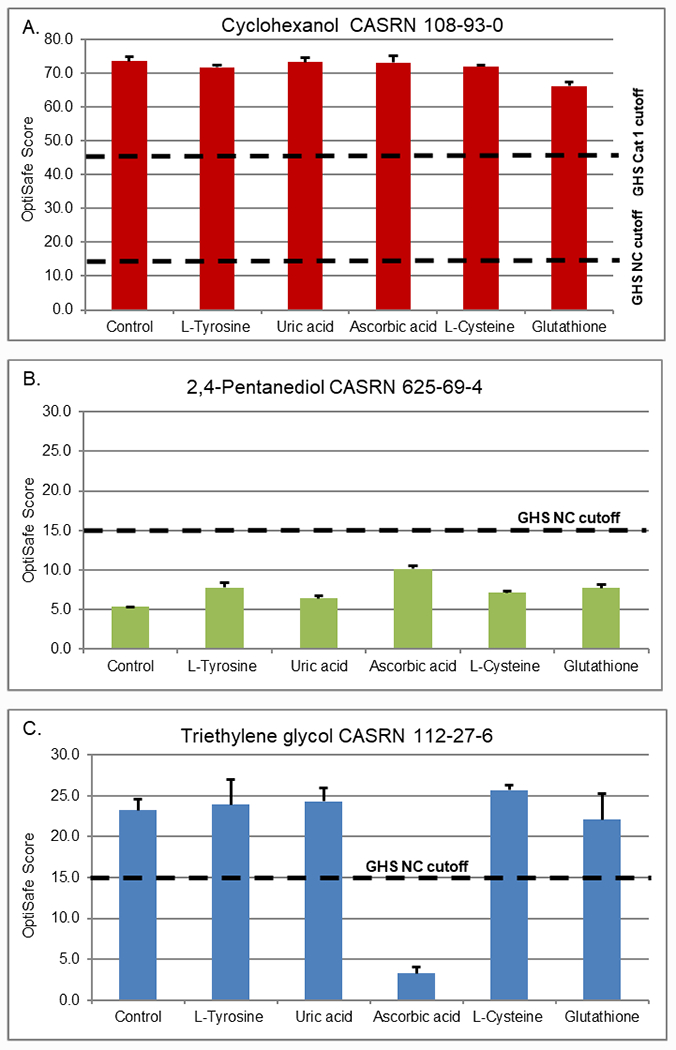
Figure 1.

Screening study of antioxidants at in vivo concentrations (control = no antioxidant, L-tyrosine at 78 μM, uric acid at 43 μM, ascorbic acid at 530 μM, L-cysteine at 14.3 μM, and glutathione at 5.5 μM). Three representative chemicals, (A) cyclohexanol GHS category 1; (B) 2,4-pentanediol GHS NC; and (C) triethylene glycol GHS NC, were used to screen the effects of each antioxidant. Dashed lines show the NC and category 1 cut-offs for the OptiSafe prediction model.
