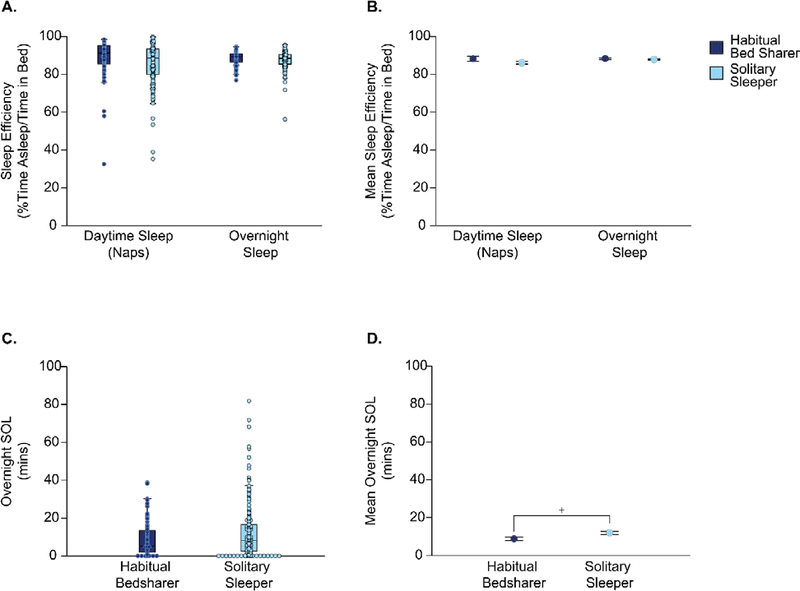
Figure 3. Sleep quality comparisons between bedsharers and solitary sleepers.

A) Distribution boxplots and B) simple means plots of nap and overnight % sleep efficiency (SE) between habitual bedsharers and solitary sleepers. C) Distribution boxplots and D) simple means plots of overnight sleep onset latency (SOL) between habitual bedsharers and solitary sleepers. Error bars on simple means plots represent ±1SE. +p<.10 after controlling for SES.
