
Figure 4. Bedtimes and waketimes of habitual bedsharers vs. solitary sleepers.
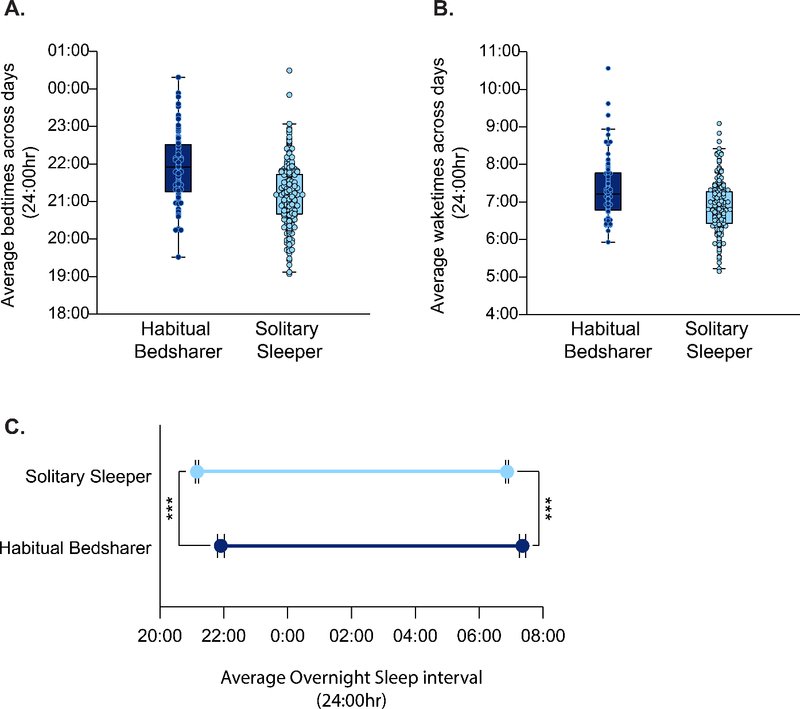
A) Distribution boxplots of average bedtimes across actigraphy days for habitual bedsharers and solitary sleepers. B) Distribution boxplots of average waketimes across actigraphy days for habitual bedsharers and solitary sleepers. C) Dropline plot depicting the average timing of habitual bedsharers’ and solitary sleepers’ overnight sleep. Error bars in C) represent ±1SE. ***p<.001, even after controlling for SES (see supplemental material for control analyses).