Fig. 2.
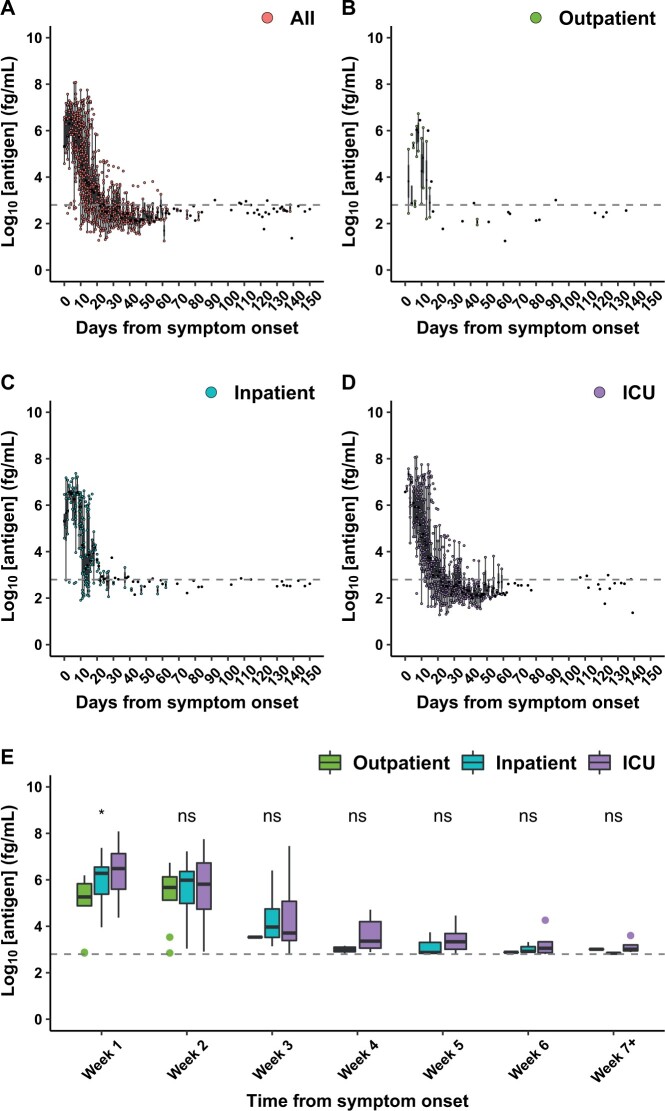
(A–D) Comparison of plasma SARS-CoV-2 nucleocapsid antigen concentration by days from symptom onset, subgrouped by disease severity, in 777 plasma samples from 104 unique individuals with respiratory NAAT-confirmed COVID-19. These samples/individuals include the 74 samples/individuals from Fig. 1. (E) Boxplots of the first positive sample from each unique individual each week after symptom onset in outpatients (left), inpatients (middle), and ICU patients (right). The dashed line represents the positivity threshold. Statistical significance from Kruskal–Wallis testing is denoted as ns: P > 0.05, *: P ≤ 0.05, **: P ≤ 0.01, ***: P ≤ 0.001.

