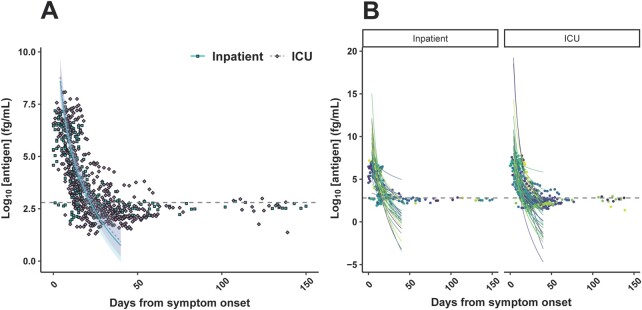
Fig. 3.
Linear mixed-effects model of plasma SARS-CoV-2 nucleocapsid antigen concentration based on days from symptom onset and disease severity, accounting for interindividual random variation, in 388 inpatient and ICU plasma samples collected between 5 and 40 days after symptom onset. The points represent observed values, while the lines represent predicted values. Inpatient vs ICU disease severity was not significantly associated with time-dependent antigen concentration, as evidenced by the overlap between shaded 95% CIs (A). Interindividual random variation (both slope and intercept) accounted for the majority of the remaining variance, with each color representing a different individual (B). The dashed line represents the positivity threshold.

