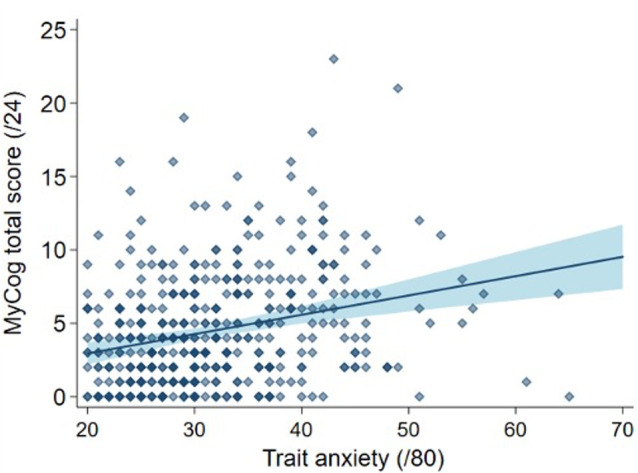
Figure 3.

Total MyCog score against trait anxiety. Scatter plot shows the raw data (n=460) of MyCog against trait anxiety. The blue line is the line of best fit from the multivariable regression model (adjusted for sex, age at assessment and anxiety and depression symptoms, Model 4). The shaded areas represent 95% CIs. Note that the minimum possible trait anxiety score is 20.
