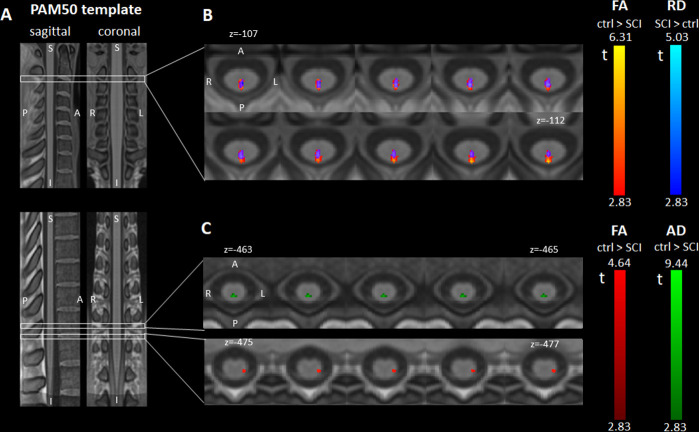
Figure 2.
Differences in diffusion tensor imaging (DTI) metrics at 2 months post injury. (A) Sagittal and coronal views of the T1-weighted PAM50 spinal cord template used for the voxel-based and atlas-based DTI analyses. (B, C) Axial slices of parametric maps representing the t values of the voxel-based two-sample t-test comparing fractional anisotropy (FA) (displayed in red), radial diffusivity (RD) (blue) and axial diffusivity (AD) (green) between controls and patients with spinal cord injury (SCI). All parametric maps were created using SPM and are overlaid on the PAM50 template for display. The displayed clusters represent voxels with significant t values at an initial voxel-level threshold of 0.005 (uncorrected) followed by peak-level threshold of 0.05 (family-wise error corrected). (B) At C2/C3 (above the lesion), significant and overlapping clusters of FA decrease and RD increase were found in the dorsal column of patients with SCI. The overlapping region is displayed in violet. (C) In the lumbar enlargement (below the lesion), patients with SCI had lower FA in the left lateral column (corresponding to the left corticospinal tract) and lower AD in the dorsal column.

