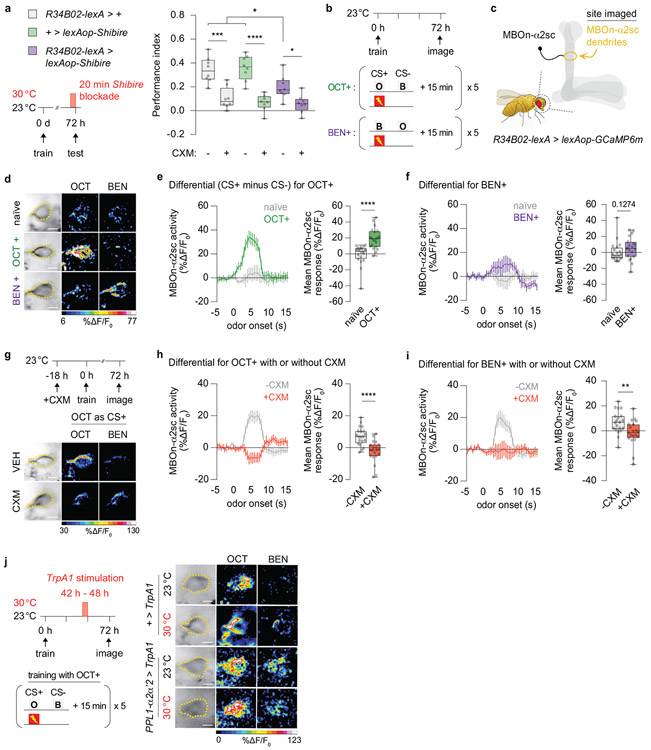
Extended Data Fig 6. Robust 72 h old PSD-LTM plasticity is formed in MBOn-α2sc.
a, Blocking synaptic output (R34B02-lexA > lexAop-Shibire) from MBOn-α2sc impaired retrieval of PSD-LTM. b, Schedule for training and imaging. c, MBOn-α2sc dendrites imaged as the region of interest. d, Representative pseudocoloured images (scale bar = 10 μm) showing responses to octanol (OCT) or benzaldehyde (BEN) for naïve, OCT+ (OCT as CS+), or BEN+ (BEN as CS+) flies. e, f, Response traces of group data and quantification for OCT+ (e) and BEN+ (f) conditioned animals relative to naïve. The left panel (line graph) displays the activity as a function of time with odour stimulation. The right panel (bar graph) displays the average response magnitude within the first 5 s of odour onset (duration of odour delivery). See methods for calculations of the activity versus mean responses. The Differential reflects the difference in odour response between CS+ minus CS−. Multiple spaced cycles generated increased calcium transients compared to naïve flies, with OCT+ generating a more potent differential than BEN+. g, Feeding schedule for CXM before spaced conditioning and representative pseudocoloured images (scale bar = 10 μm) showing the effects of CXM on odour responses. h, i, CXM+ blunted the OCT+ (h) or BEN+ (i) training-induced calcium transients indicating that the differential represents a PSD-LTM trace. j, Training schedule and representative pseudocoloured images (scale bar = 10 μm) without (23 °C) or with (30 °C) a 6 h TrpA1 stimuation. Response traces and quantificaiton are in Fig. 3b. Box-and-whisker plots show the range of individual data points, the interquartile spread as the box, and the median as the line bisecting each box. * P < 0.05, ** P < 0.01, *** P < 0.001, **** P < 0.0001; n = 8 (a), two-way ANOVA with Tukey’s test; n = 20 (e, naïve), n = 21 (e, OCT+), n = 20 (f, naïve), n = 20 (e, BEN+), n = 20 (h, i), unpaired two-tailed Mann-Whitney test (e, f, h, i). Imaging experiments (d-j) were performed three independent times with proper controls present within each set. All activity traces, mean responses and representative images shown were reproducible. Exact P-values and comparisons are shown in Supplementary Information.

