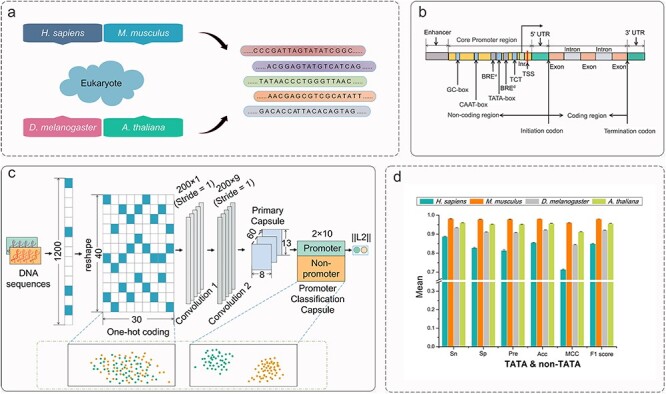
Figure 1.

Depicter overview. (A) Depicter studies species including H. sapiens, M. musculus, D. melanogaster and A. thaliana. (B) Genetic structure of eukaryotic cells. (C) Overall architecture of Depicter. (D) Models evaluation and validation, and the part of the figure show the average performances of 5-fold cross-validation running five-time on the benchmark datasets for the TATA and non-TATA type.
