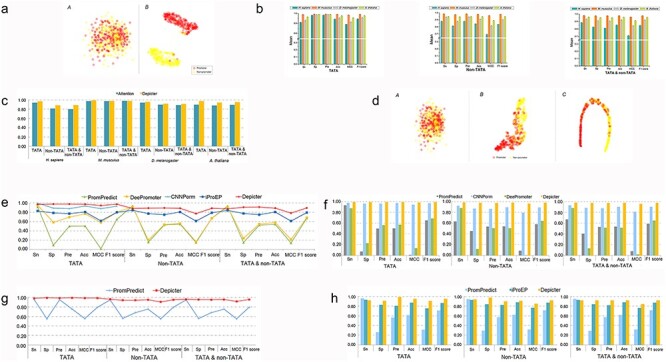
Figure 2.

Using Depicter to explore comparative performance. (A) T-SNE plots for the one-hot encoding vector (a) and feature representation after capsule layer (b), in which red dots represent promoters and yellow dots represent nonpromoters, respectively. (B) The average performances of all four species on five times 5-fold cross-validation tests using the benchmark datasets. (C) Comparison of AUC values of attention model and Depicter on the benchmark datasets. (D) T-SNE visualization of the one-hot encoding feature representation (a), feature representation after the attention layer (b), and feature representation for the 2nd fully connected layer (c). (E–H) Performance comparison between Depicter and other existing methods on the independent test sets for H. sapiens (E), M. musculus (F), A. thaliana (G) and D. melanogaster (H).
