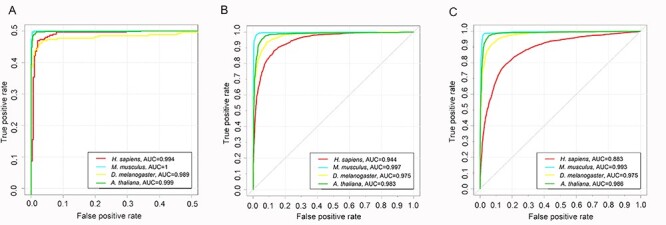
Figure 3.

ROC curves of Depicter models for: (A) TATA types promoters; (B) non-TATA types promoters; and (C) TATA and non-TATA types promoters on the independent test datasets.

ROC curves of Depicter models for: (A) TATA types promoters; (B) non-TATA types promoters; and (C) TATA and non-TATA types promoters on the independent test datasets.