
Figure 1. Diet impacts Aβ-induced paralysis, energy availability, oxidative stress, and mitochondrial morphology without altering Aβ accumulation.
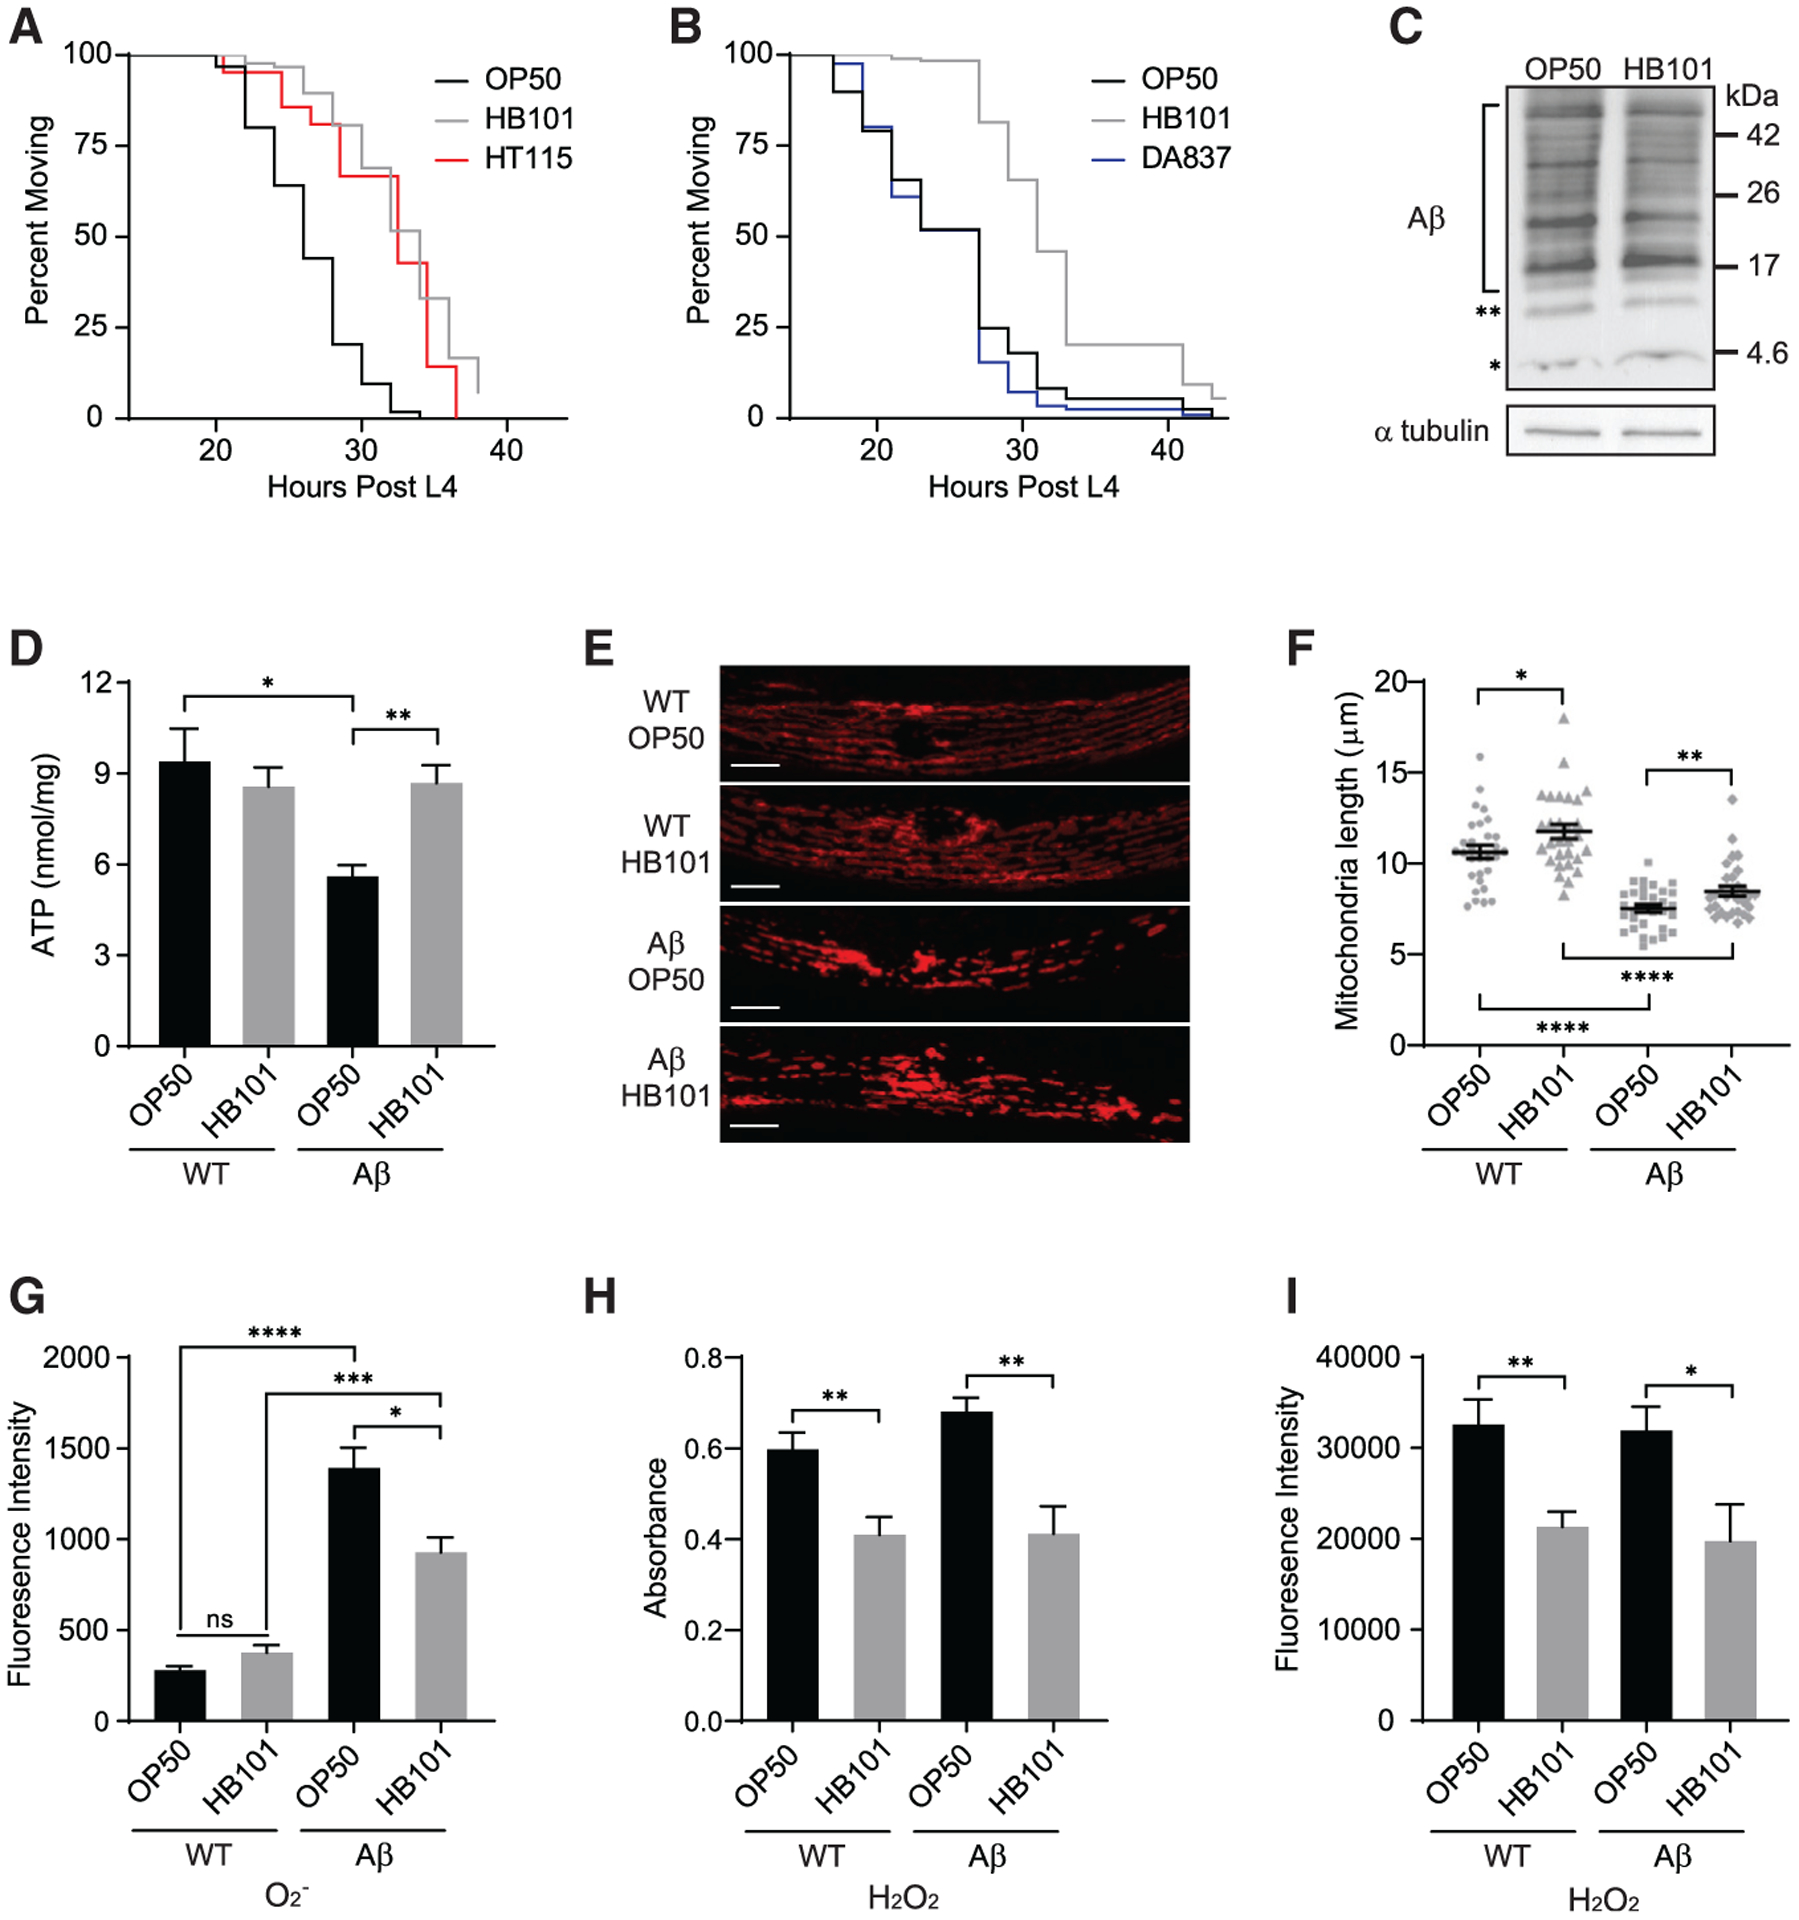
(A) Aβ animals fed HB101 (gray) and HT115 (red) exhibited delayed paralysis compared to those on OP50 (black) (n ≥ 89).
(B) Aβ animals fed DA837 (blue) and OP50 (black) became paralyzed at the same time (n ≥ 183).
(C) Western analysis showed no effect of diet on Aβ accumulation. The Aβ monomer and dimer are indicated by asterisks (* and **, respectively); bracket shows Aβ oligomers. Additional replicates are in Figure S1F.
(D) ATP levels in Aβ C. elegans fed OP50 were reduced compared to wild type (WT); the HB101 diet increased ATP in Aβ animals (n ≥ 10).
(E) Representative images of mitochondria, visualized with TOMM-20∷RFP, in WT and Aβ animals. Scale bars, 10 μm.
(F) Average mitochondrial length was affected by Aβ accumulation and diet; individual measurements (gray symbols, n ≥ 30) indicated.
(G) Superoxide (O2−), measured with MitoSox, was higher in Aβ animals fed OP50 versus HB101 (n ≥ 11).
(H) Hydrogen peroxide (H2O2) level, quantified with Amplex red, was greater in both WT and Aβ nematodes given OP50 (n ≥ 7).
(I) H2O2, measured with H2DCFDA, was increased in WT and Aβ animals fed OP50 (n ≥ 8).
Error bars show SEM; *p < 0.05, **p < 0.01, and ***p < 0.001, one-way ANOVA with Dunnett’s post-test. See also Figures S1 and S2.