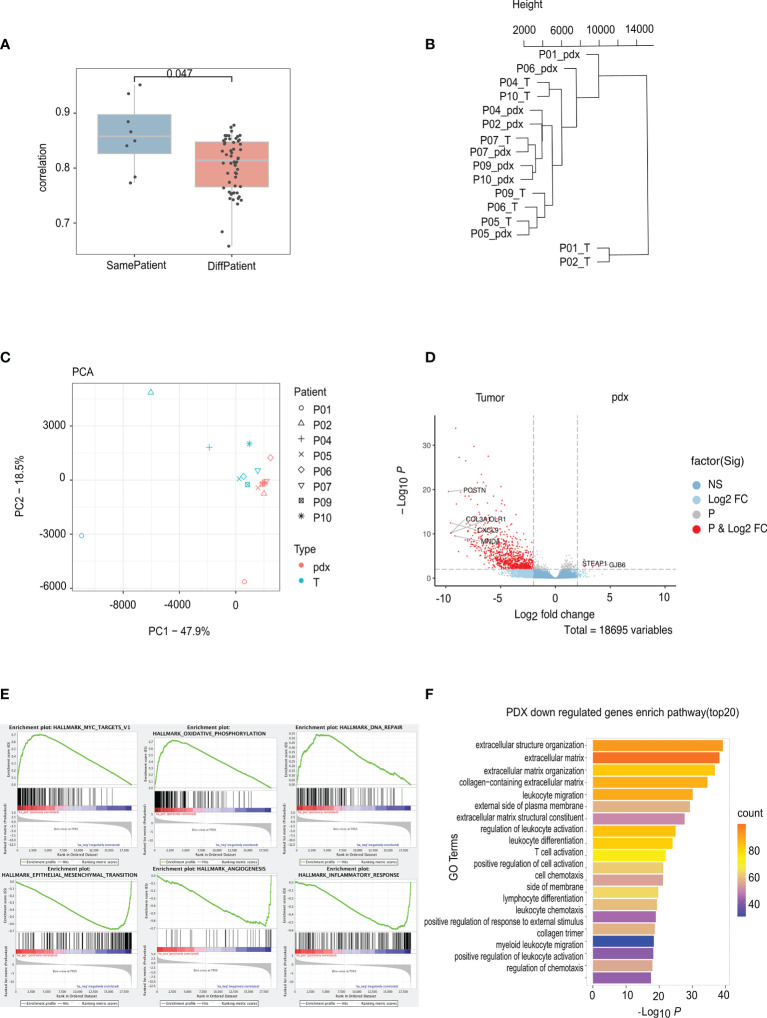
Figure 4.
RNA sequencing analyses of PA and PDX tumors. (A) The correlation between PA and PDX samples from the same patient is significantly higher than that between samples from different patients. (B) This phylogenetic tree depicts relationships of nine PA samples and their corresponding PDX samples at the RNA level. There is no clustering tendency of PDX and its original PA samples. (C) The technique of PCA was used to simplify the complexity in high-dimensional data of RNA sequencing and to visualize clustering of samples. PDX and PA samples are roughly separated by the dotted line, indicating an altered mode of transcription due to implantation. (D) DEGs volcanic figure. (E) PDX overexpressed genes clustered in Myc, oxidative phosphorylation, and DNA damage repair pathways, while low-expressed genes clustered in interstitial transformation, angiogenesis, and inflammatory responses. (F) GO analysis of low expression gene of PDX. PA, patient tumor; PDX, patient-derived xenograft; PCA. principal component analysis; DEGs, different expression genes.

