
Figure 5.
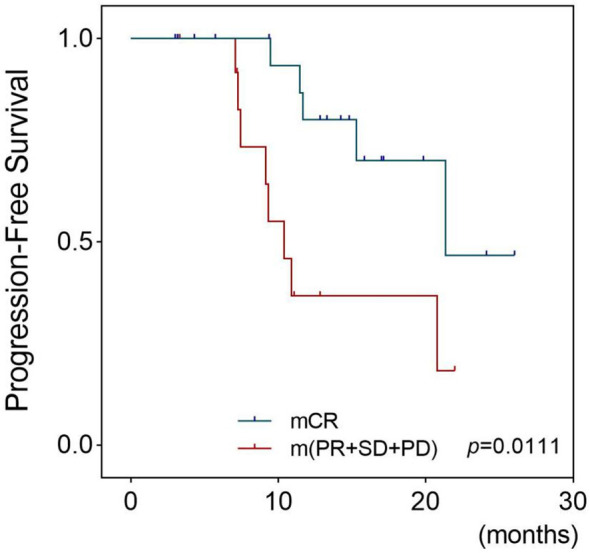
Survival outcomes of patients whose PDX models had different platinum responses. This figure shows the Kaplan–Meier plots for progression-free survival of EOC patients who received chemotherapy based on platinum. Patients were divided into two groups: the mCR group whose corresponding models achieved mCR and the m(PR+SD+PD) group whose models were evaluated as mPR, mSD, or mPD. The Tick marks indicate censored data. p-values were estimated with the use of log-rank test based on the univariate analysis. PDX, patient-derived xenograft; EOC, epithelial ovarian cancer; mCR, modified complete response; mPR, modified partial response; mSD, modified stable disease; mPD, modified progressive disease.