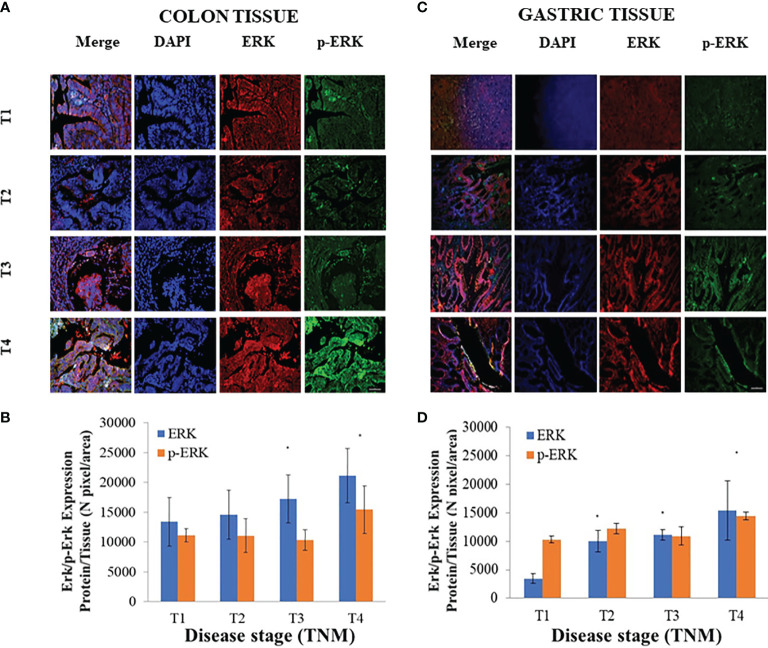
Figure 5.
Evaluation of extracellular signal-regulated protein kinase (ERK)1/2 and p-ERK1/2 expression levels in tissues derived from (26) colorectal cancer (CRC) or (20) gastric cancer (GC) patients. Representative confocal microscopy images (A, C) for the detection of ERK1/2 and p-ERK1/2, along with ERK1/2 and p-ERK1/2 expression levels (B, D), evaluated by fluorescence intensity index analysis, in CRC (A, B) and GC (C, D) tissues at different TNM stages. Blue channel: nuclei; green channel: labeled p-ERK1/2; red channel: labeled ERK1/2 and corresponding overlay. Scale bar, 50 µm; Magnification, ×20. (*) p < 0.005 vs. CRC or GC patients with stage T1 (A–D).

