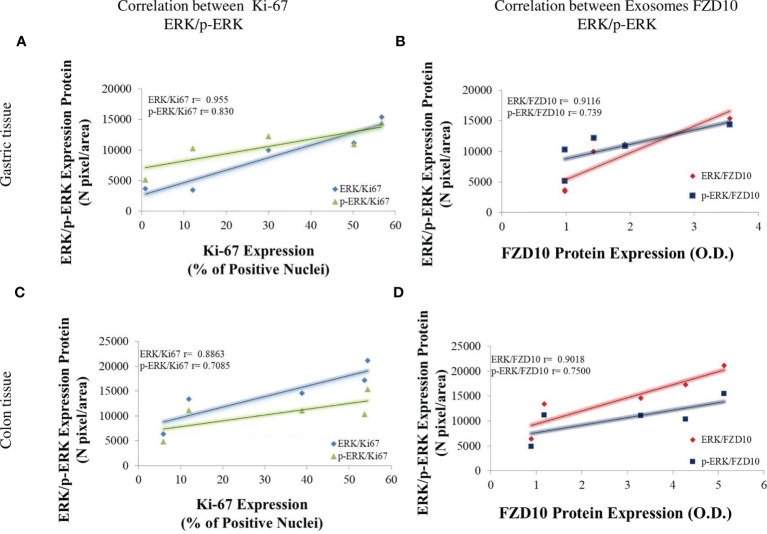
Figure 7.
Pearson’s correlation of all evaluated markers. Pearson’s correlations between expression levels of Ki-67 vs. extracellular signal-regulated protein kinase (ERK)1/2 (blue line) and Ki-67 vs. p-ERK (green line) by immunofluorescence analysis in gastric cancer (GC) (A) or colorectal cancer (CRC) (C) tissues at different TNM stages (A, C). Pearson’s correlations between expression levels of ERK1/2 vs. Frizzled (FZD)10 (red line) and p-ERK vs. FZD10 (dark blue line). Expression levels of FZD10 were evaluated in exosomes by Western blotting analysis, while expression levels of ERK and p-ERK were evaluated in tissues by immunofluorescence analysis of GC (B) or CRC (D) patients at different TNM stages (B, D). In all the plots, each point was obtained as average value of all enrolled CRC or GC patients enrolled at the same TNM stage (from T1 to T4). p < 0.005.

