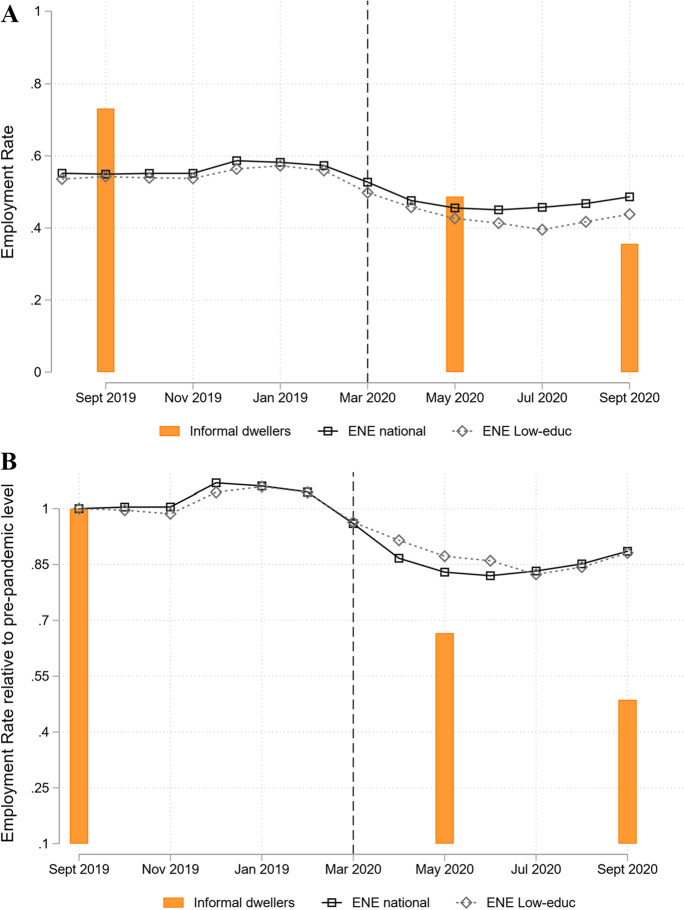
Fig. 1.
Evolution of the employment rate as the proportion of individuals employed (A) and relative to pre-pandemic levels (B). The figure shows the evolution of the employment rate before and after the Covid-19 pandemic period for different survey series. Panel A shows the employment rate as the proportion of people employed divided by the population older than 15 years old on each survey. Panel B shows the employment rate evolution relative to the average level observed during the pre-pandemic months observed on each series. The vertical dashed line marks the beginning of the pandemic in Chile. From ENE monthly surveys, we plotted both the evolutions of the nationally representative sample and a subsample of respondents who reported less than complete secondary education and were residing in municipalities with at least one informal settlement. Information on informal dwellers was obtained from Techo-Panel Survey 2019–2020

