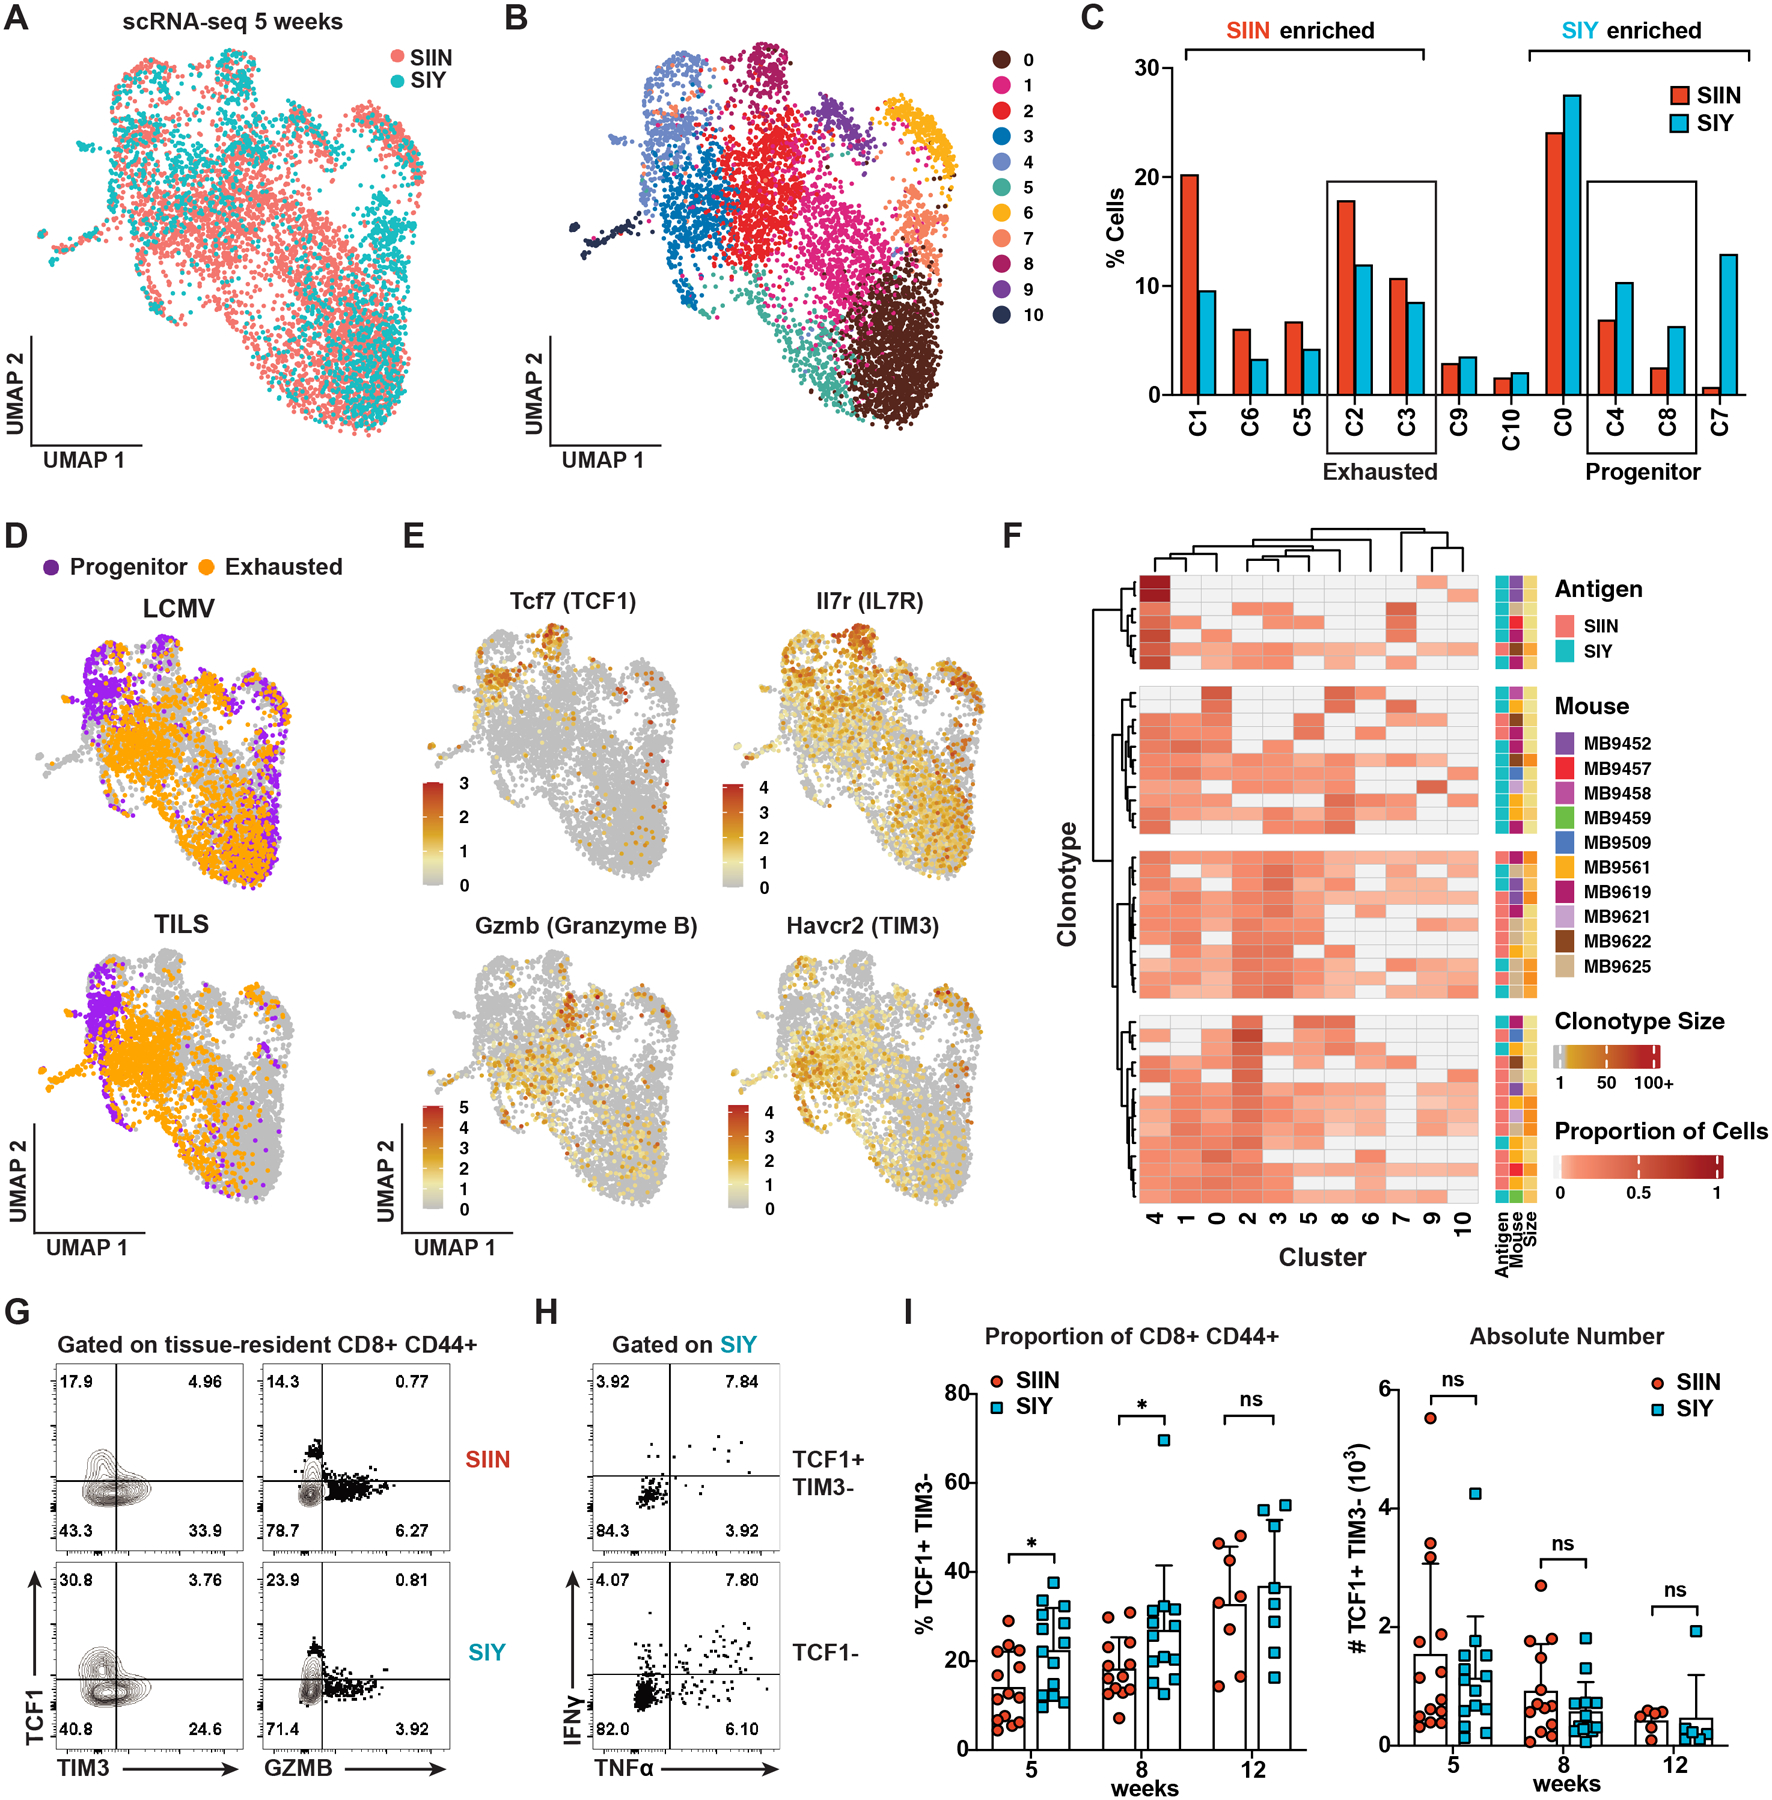
Figure 2. Single-Cell RNA-Sequencing Reveals Enrichment of a TCF1+ Progenitor Cell Phenotype Amongst SIY-Specific CD8 T Cells.

(A) UMAP embedding of scRNA-seq 5’ gene expression data comparing SIIN- and SIY-specific CD8 T cells at 5 weeks post-tumor initiation. n = 10 mice, 4,023 SIIN and 1,861 SIY cells.
(B) Unsupervised clustering of the scRNA-seq data in (A).
(C) Assignment of SIIN- versus SIY-specific cells to the clusters in (B). Brackets indicate significant enrichment (p < 0.05) for SIIN- or SIY-specific cells.
(D) Classification of individual cells from (A) using the ProjecTILs pipeline (Andreatta et al., 2021). SIY-specific cells are enriched for a progenitor phenotype (TIL p = 0.002; LCMV p = 2.51E-15); SIIN-specific cells are enriched for an exhausted phenotype (TIL p = 4.01E-17; LCMV p = 1.52E-10).
(E) Log-normalized expression of genes associated with progenitor (Tcf7 and Il7r) or exhausted Gzmb and Havcr2) cell states.
(F) Heatmap depicting proportions of TCR clonotypes (rows) assigned to each cluster (columns), for clonotypes ≥ 5 cells with ≥ 1 cell assigned to TCF1+ progenitor clusters C4 or C8.
(G-H) Percentage of SIIN- versus SIY-specific cells expressing TCF1, TIM3 and GZMB (G) and the proportion of SIY-specific TCF1+ TIM3− and TCF1− cells expressing IFNɣ and TNFα (H) at 5 weeks by flow cytometry.
(I) Percentage and absolute number of SIIN- and SIY-specific TCF1+ TIM3− cells over time by flow cytometry.
(G-I) are representative of 3 independent experiments, n ≥ 5 mice per group.
