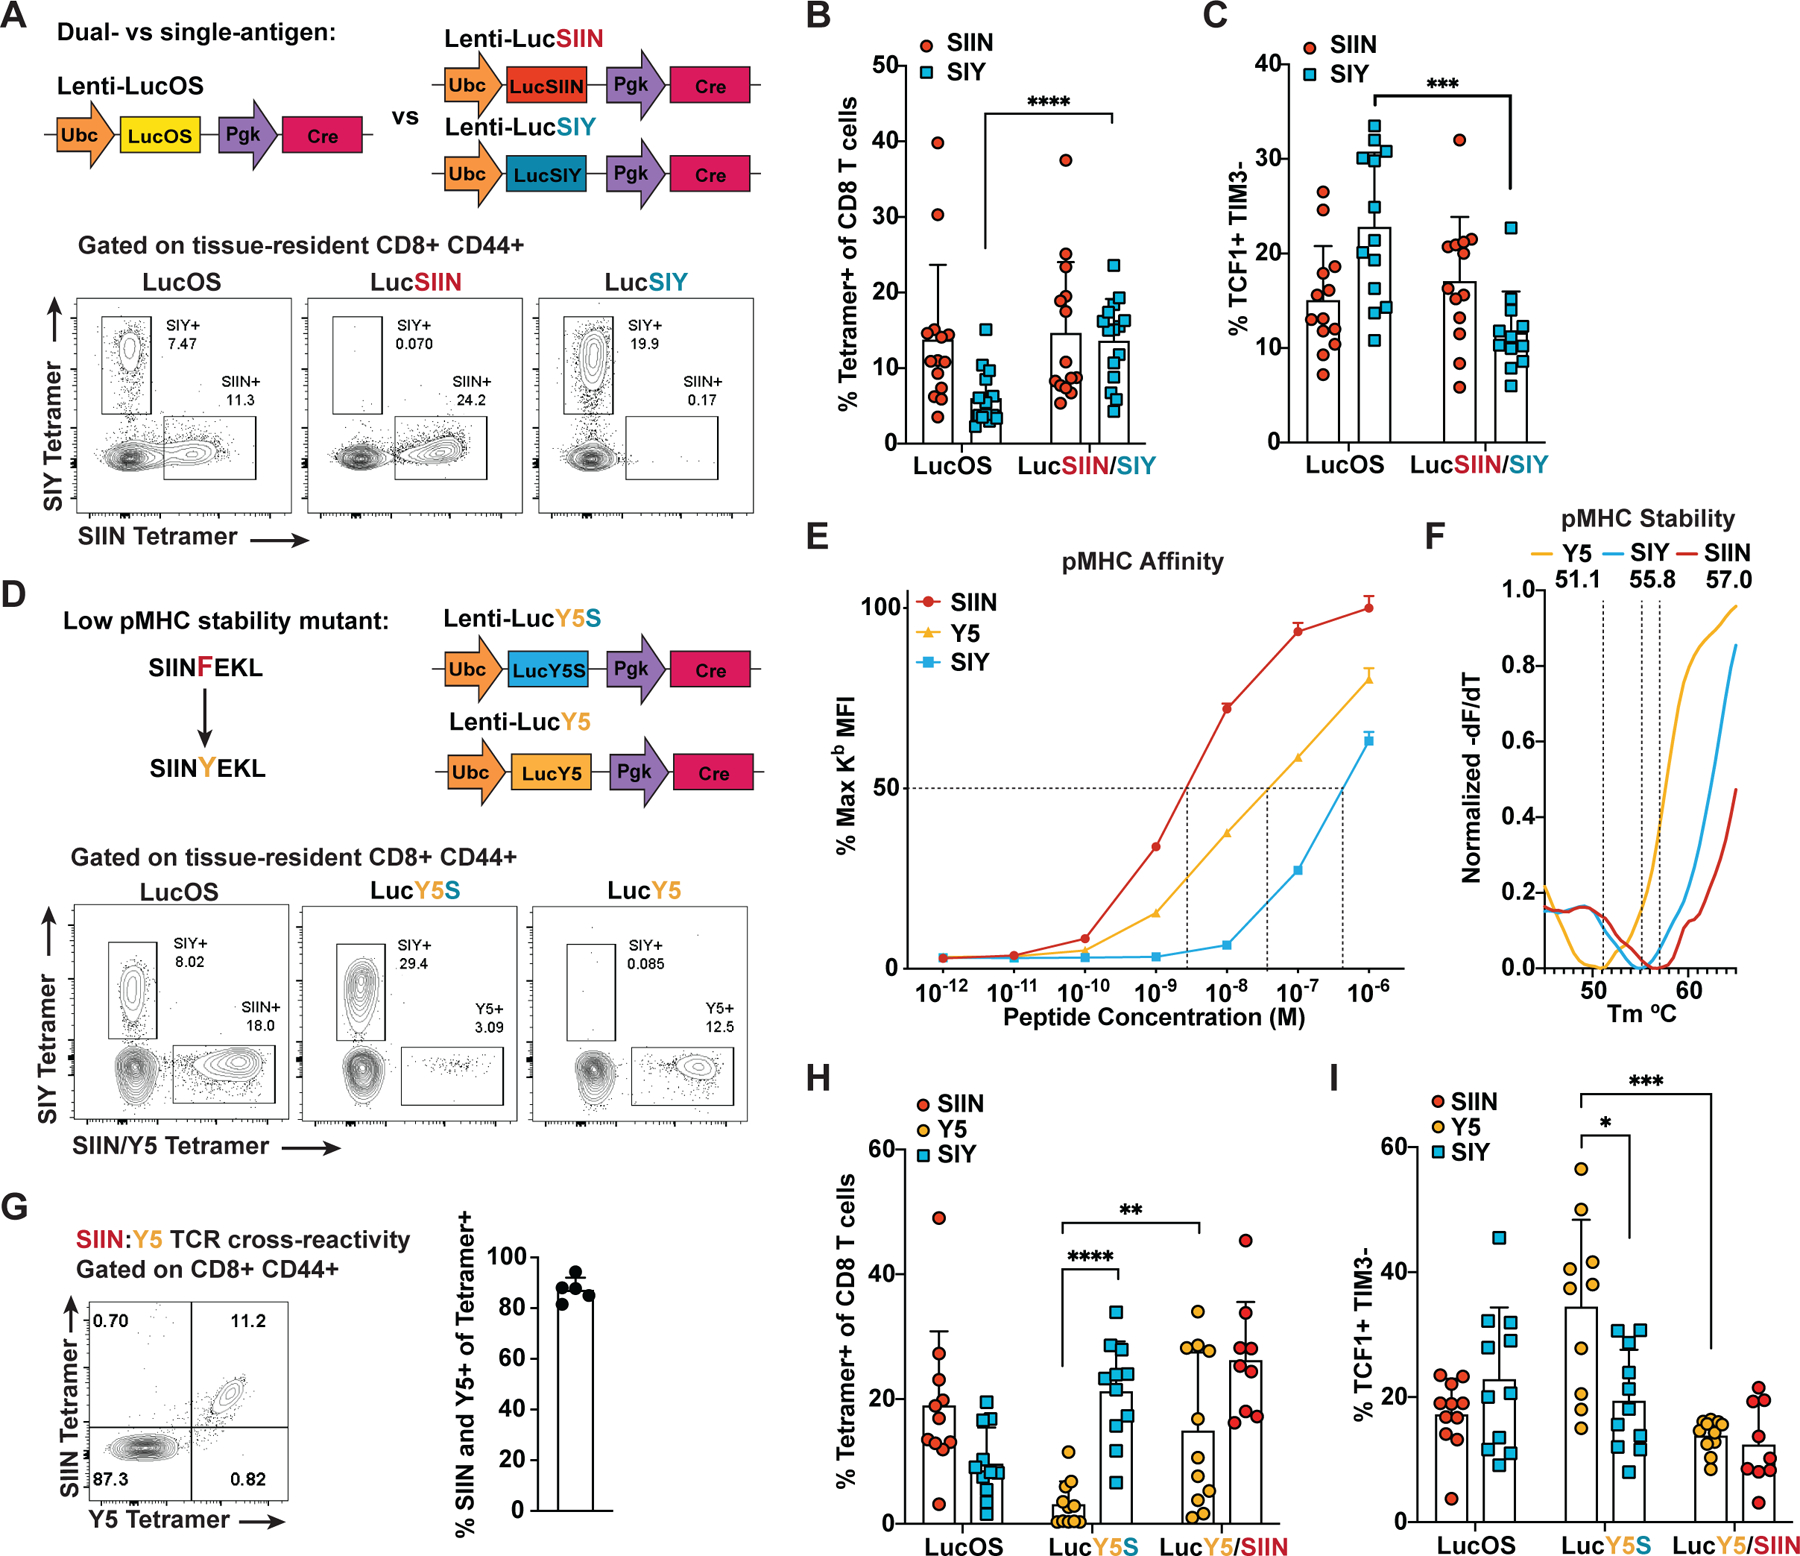
Figure 3. Enrichment of TCF1+ Progenitor Cells in the SIY Response is Driven by an Antigen Dominance Hierarchy.

(A) Lentiviral constructs expressing SIIN and SIY (LucOS), SIIN-only (LucSIIN) and SIY-only (LucSIY) and representative flow cytometry plots of antigen-specific cells in the lung 5–6 weeks post-tumor initiation.
(B and C) Percentage of SIIN- and SIY-specific cells of CD8 T cells (B) and the proportion that are TCF1+ TIM3− (C) in LucOS, LucSIIN and LucSIY mice at 5–6 weeks by flow cytometry.
(D) Lentiviral constructs expressing SIINYEKL (Y5) in combination with SIY (LucY5S) or alone (LucY5) and representative flow cytometry plots of antigen-specific cells in the lung 5–6 weeks post-tumor initiation.
(E) pMHC affinity for each antigen assessed by flow cytometric quantification of H-2Kb stabilization on TAP-deficient RMA-S cells. Dotted lines = 50% binding concentration, which approximates the affinity (Kd) of each peptide for H-2Kb.
(F) pMHC complex stability (Koff) for each antigen measured by Differential Scanning Fluorimetry of pMHC thermal melting. Dotted lines = melting temperature (Tm) of each pMHC complex. Displayed Tm values are averaged from 3 experiments.
(G) TCR cross-reactivity measured by SIIN and Y5 tetramer co-staining of CD8 T cells from spleens of SIIN-vaccinated mice. Percentage of tetramer+ cells stained by both tetramers is graphed.
(H-I) Percentage of Y5-, SIIN- and SIY-specific cells of CD8 T cells (H) and the proportion that are TCF1+ TIM3− (I) at 5–6 weeks in LucOS, LucY5S, LucY5 and LucSIIN mice.
(A-F) and (H-I) are representative of ≥ 3 independent experiments, n ≥ 5 mice per group. (E and G) are representative of 2 independent experiments.
