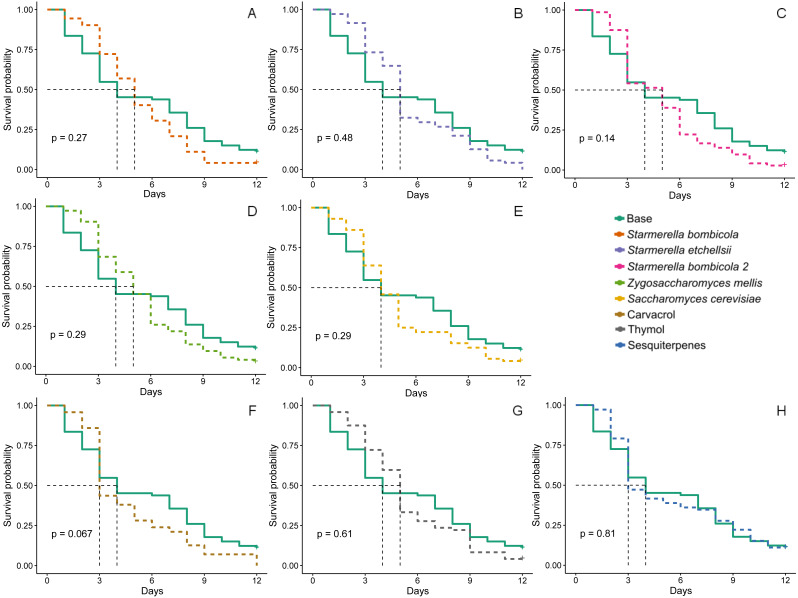
Figure 2. Survival probability.
Survival curves for Africanized worker beesApis mellifera fed one of nine artificial diets for 12 days. Enriched diets contained one of five bee-associated yeasts or one of three types of essential oil: (A) Starmerella bombicola; (B) Starmerella etchellsii; (C) Starmerella bombicola 2; (D) Zygosaccharomyces mellis; (E) Saccharomyces cerevisiae; (F) carvacrol; (G) thymol; (H) sesquiterpenes. Each plot compares the control (base) to each treatment diet. Dashed black lines indicate median survival time. P-values are derived from the Log-Rank test to compare differences between the control diet and each treatment group. Data points depict the mean value of survival probability.

