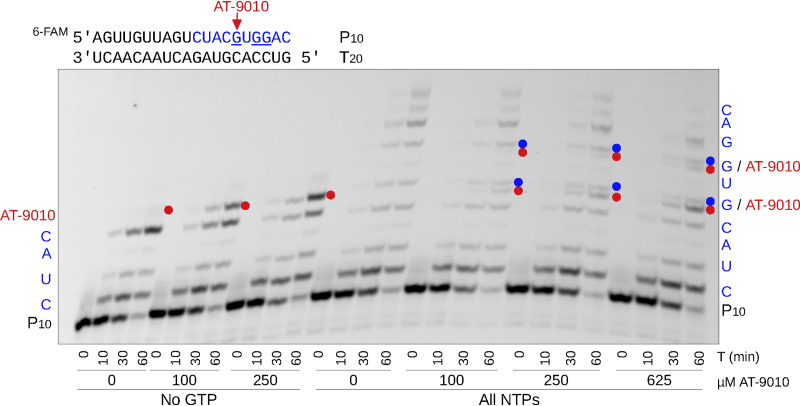
FIG 3.
Incorporation of AT-9010 in the presence and absence of GTP. The left half of the gel shows the time course of elongation of P10 primer along a T20 RNA template by the DENV2 NS5 protein with ATP, UTP, and CTP (100 μM each) and increasing concentrations of AT-9010 (0 to 250 μM). The right half of the gel shows elongation in the presence of all four NTPs (100 μM) in competition with AT-9010 (100 to 625 μM). The AT-9010 incorporation products at +5 and +7 positions are shown with red dots, while incorporation of the native GTP at the same positions are shown with blue dots.

