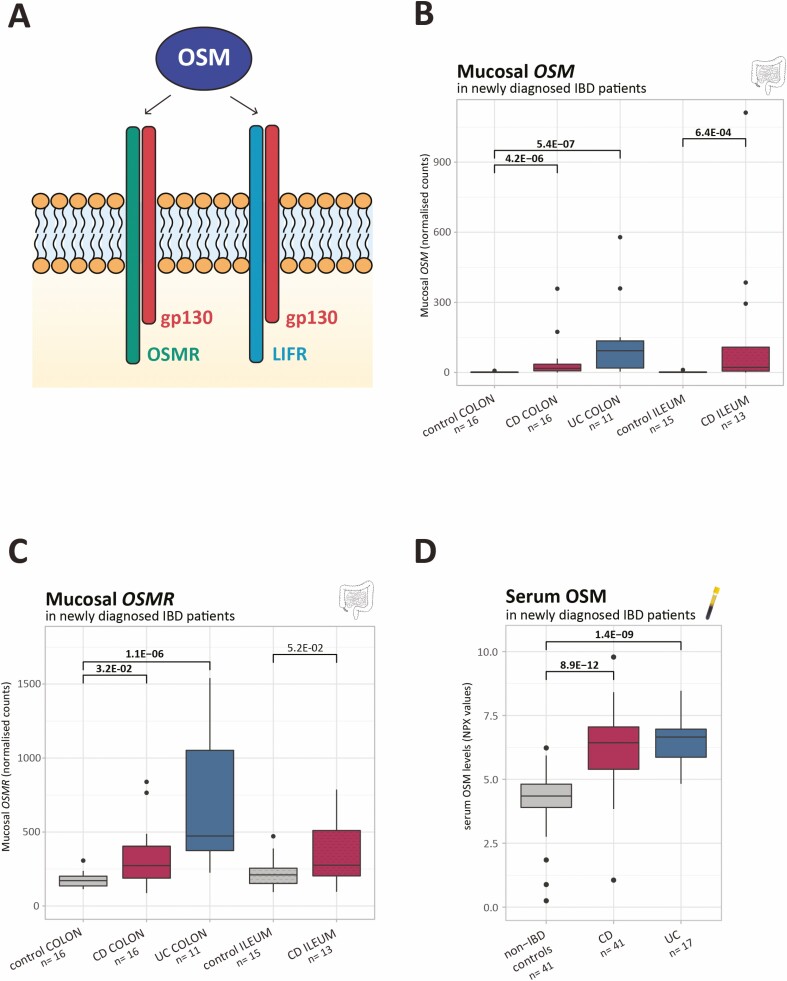
FIGURE 1.
Mucosal OSM and OSMR levels and serum OSM in newly diagnosed patients with IBD. A, OSM signals via a receptor complex composed of the gp130 co-receptor and either OSMR or LIFR. B-C, Boxplots of mucosal OSM and OSMR as measured by RNA sequencing (normalized counts). D, Boxplots of serum OSM as measured by the OLINK proximity extension technology (NPX values). Significant comparisons are highlighted in bold. NPX indicates normalized protein expression values.

