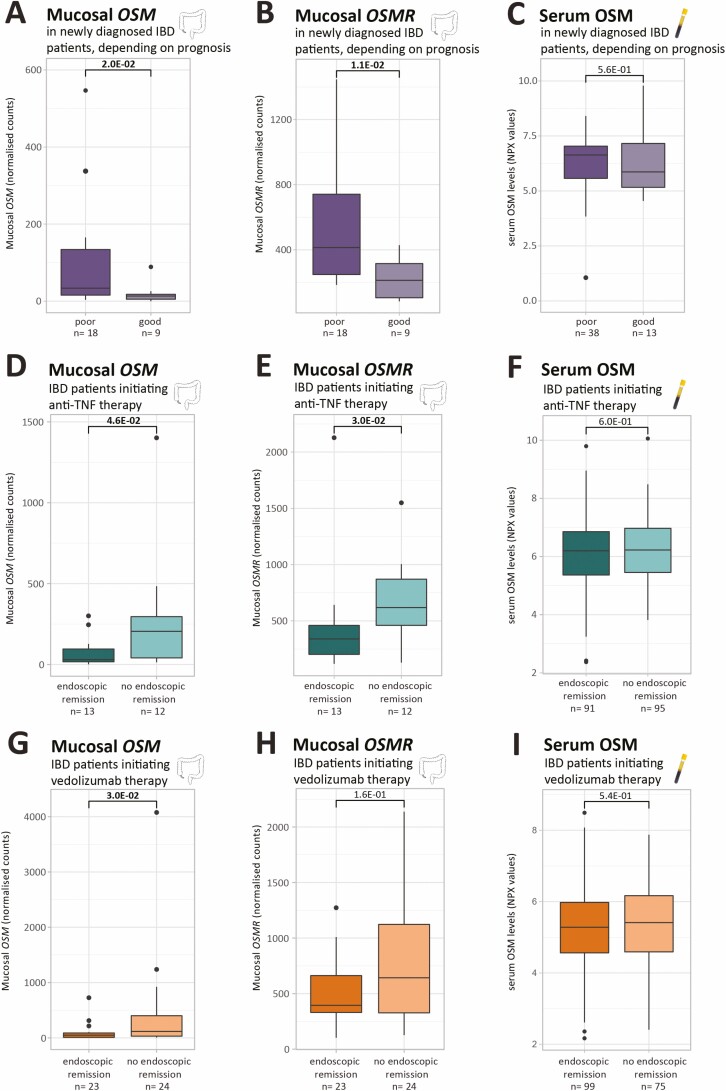
FIGURE 3.
Mucosal OSM and OSMR levels and serum OSM in newly diagnosed patients with IBD depending on disease prognosis and in patients with IBD initiating anti-TNF or vedolizumab therapy. A-B, D-E, G-H. Boxplots of mucosal OSM and OSMR as measured by RNA sequencing (normalized counts). C, F, I, Boxplots of serum OSM as measured by the OLINK proximity extension technology (NPX values). Significant comparisons are highlighted in bold. NPX indicates normalized protein expression values.

