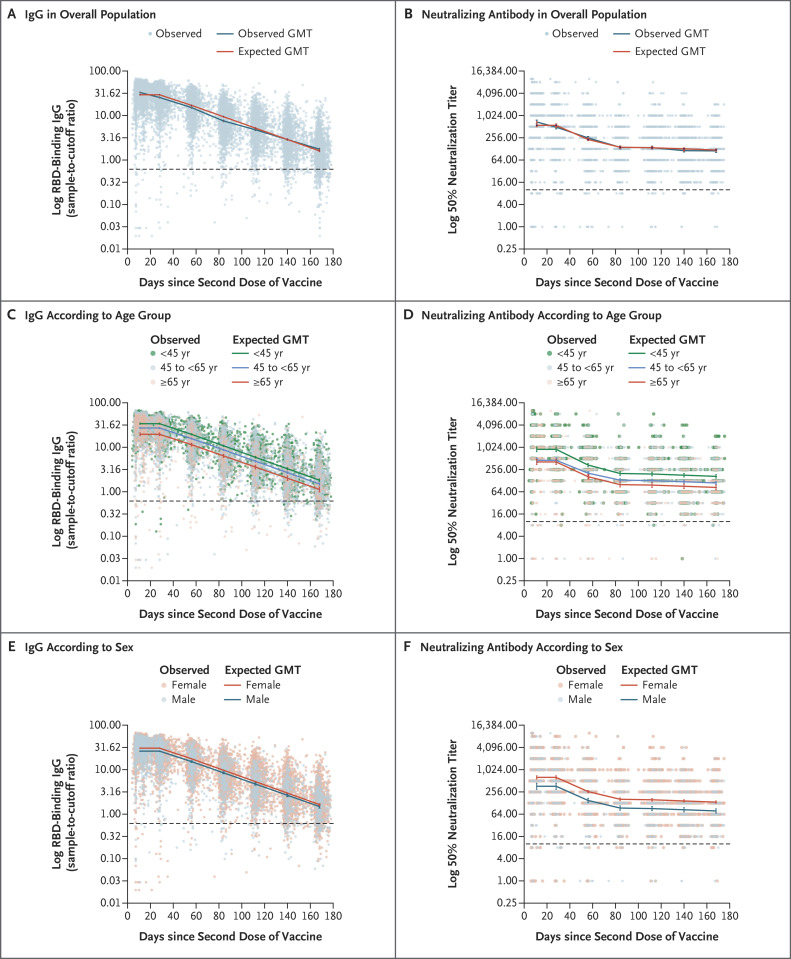
Figure 2. Distribution of Antibodies 6 Months after Receipt of Second Dose of the BNT162b2 Vaccine.
Panels A and B show the geometric mean titers (GMTs) of IgG and neutralizing antibody, respectively, in the entire study population, and Panels C through F show GMTs according to age group and sex. Antibodies were tested monthly throughout seven periods after receipt of the second dose of vaccine. Dots represent individual observed serum samples. The dashed line in each panel indicates the cutoff for diagnostic positivity. 𝙸 bars indicate 95% confidence intervals. RBD denotes receptor-binding domain.

