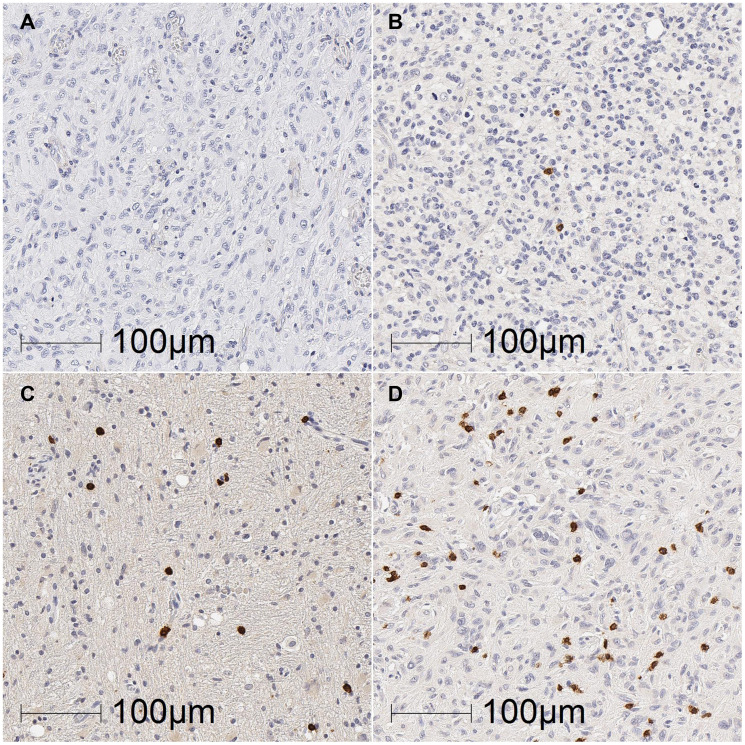
Figure 2. Representative images of TIL density in glioblastoma tumours.
Glioblastoma sections were labelled for CD3+, CD8+, CD4+ and PD-1+ TILs by DAB immunohistochemistry and scored based on the density of TILs as 0 (absent; A), 1 (present; B), 2 (moderate; C), or 3 (marked; D). Representative images from sections labelled for CD3+ TILs (B, C and D) or CD4+ TILs (A; no sections labelled for CD3 had completely absent TILs). Scale bar = 100 μm.

