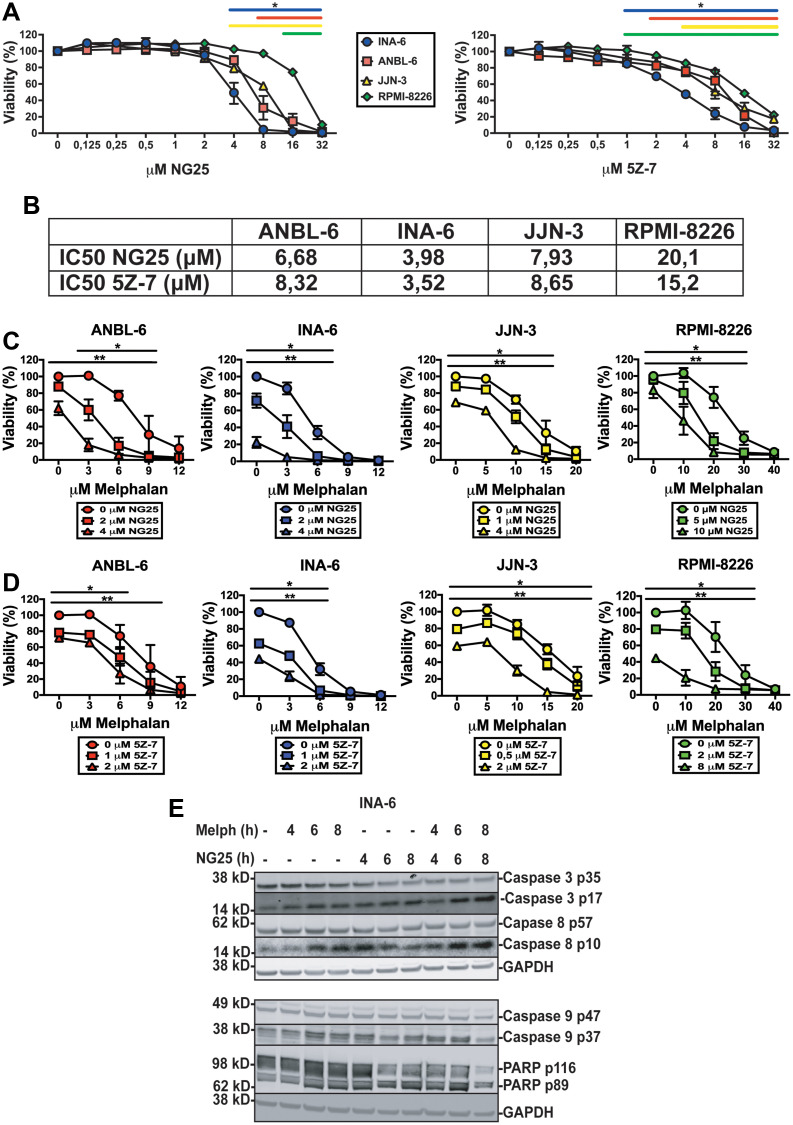
Figure 1. TAK1-inhibitors are cytotoxic to MM cell lines alone and in combination with melphalan.
MM cell lines treated with NG25 or 5Z-7 at indicated concentrations for 18 hours before measuring the viability with CellTiter-Glo. (A) Mean and SD from three independent experiments are shown. Asterisks indicate statistically significant differences (One-way ANOVA, Tukey’s multiple comparison test, P < 0,05) compared with untreated. (B) IC50-values of NG25 and 5Z-7 in MM cell lines. (C) MM cell lines treated with NG25 in combination with melphalan. Asterisks indicate statistically significant differences (two-way ANOVA, Tukey’s multiple comparison test, P < 0,05) compared with the control not treated with NG25. Single asterisk denotes statistical significance as compared to the NG25-untreated for the lowest dose of NG25, double asterisk denotes statistical significance as compared to the untreated control for the highest dose of NG25. (D) MM cell lines treated with 5Z-7 in combination with melphalan. Asterisks indicate statistically significant differences (two-way ANOVA, Tukey’s multiple comparison test, P < 0,05) compared with the control not treated with 5Z-7. Single asterisk denotes statistical significance as compared to the control not treated with 5Z-7 for the lowest dose of 5Z-7, double asterisk denotes statistical significance as compared to the untreated control for the highest dose of 5Z-7. (E) MM cells from the INA-6 cell line were treated with 2 μM NG25 or 10 μM melphalan or both at the indicated time points (hours, h), and cell lysates were analyzed for full length and cleaved caspase 3, caspase 8, caspase 9, and PARP protein levels by immunoblotting. GAPDH is loading control, shown for corresponding membranes. One representative of three independent experiments is shown, and full membranes of all experiments are given in Supplementary Figure 4.

