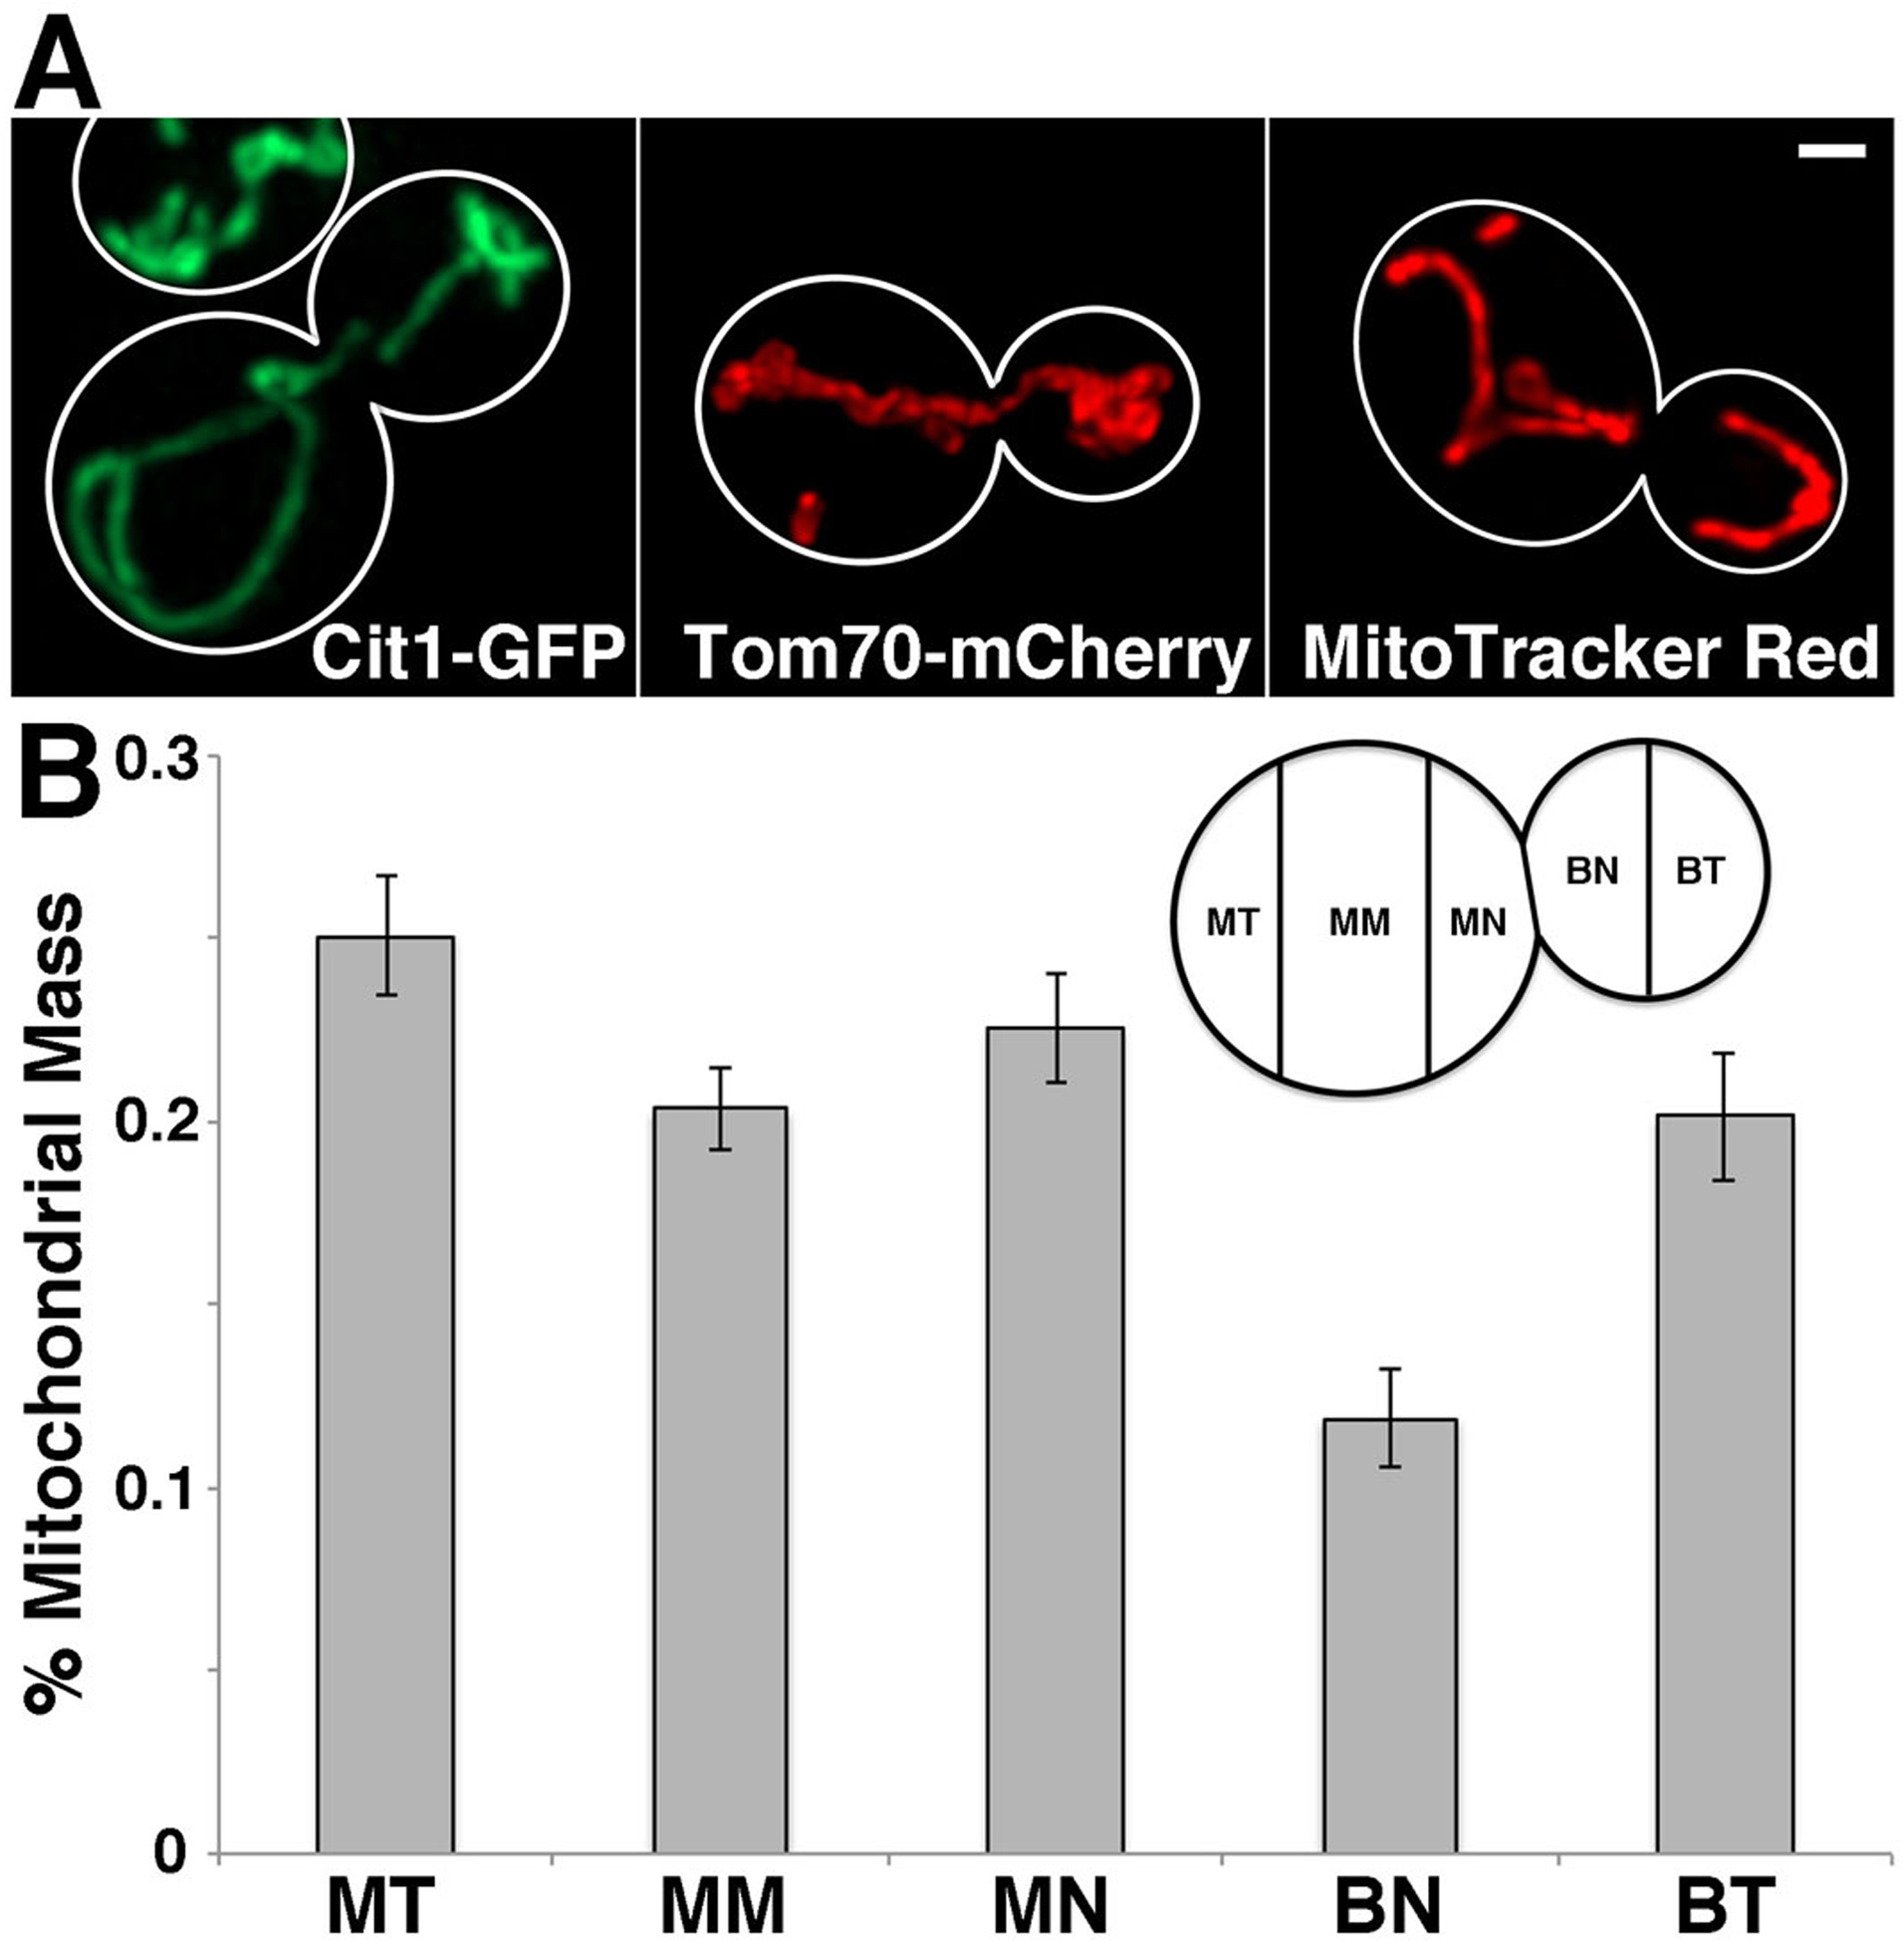
Fig. 1. Visualization of mitochondrial morphology and distribution.

A) Mitochondria were visualized by tagging Cit1p, a mitochondrial matrix protein, with GFP (left panel); Tom70p, a mitochondrial outer membrane protein, with mCherry (middle panel); and using the lipophilic dye, MitoTracker Red (right panel). Scale bar = 1 μM. Images were acquired using a standard GFP filter with 100 ms exposure time for GFP and a standard DsRed filter with 200 ms exposure time for mCherry and MitoTracker Red. B) Mitochondrial distribution was measured by separating the yeast cell into 5 different compartments as shown in inset: tip of the bud distal to the mother (bud tip), tip of the bud adjacent to the mother (bud neck), tip of the mother cell adjacent to the bud (mother neck), middle of the mother cell (mother middle), and tip of the mother cell distal to the bud (mother tip). MT = mother tip; MM = mother middle; MN = mother neck; BN = bud neck; BT = bud tip. Mitochondrial content in each region was assessed by measuring the integrated intensity of Cit1-GFP fluorescence in yeast cells bearing a large bud (0.60 to 0.80 ratio of bud to mother size). Error bars indicate SEM. n = 40. Data is representative of 3 experiments.
