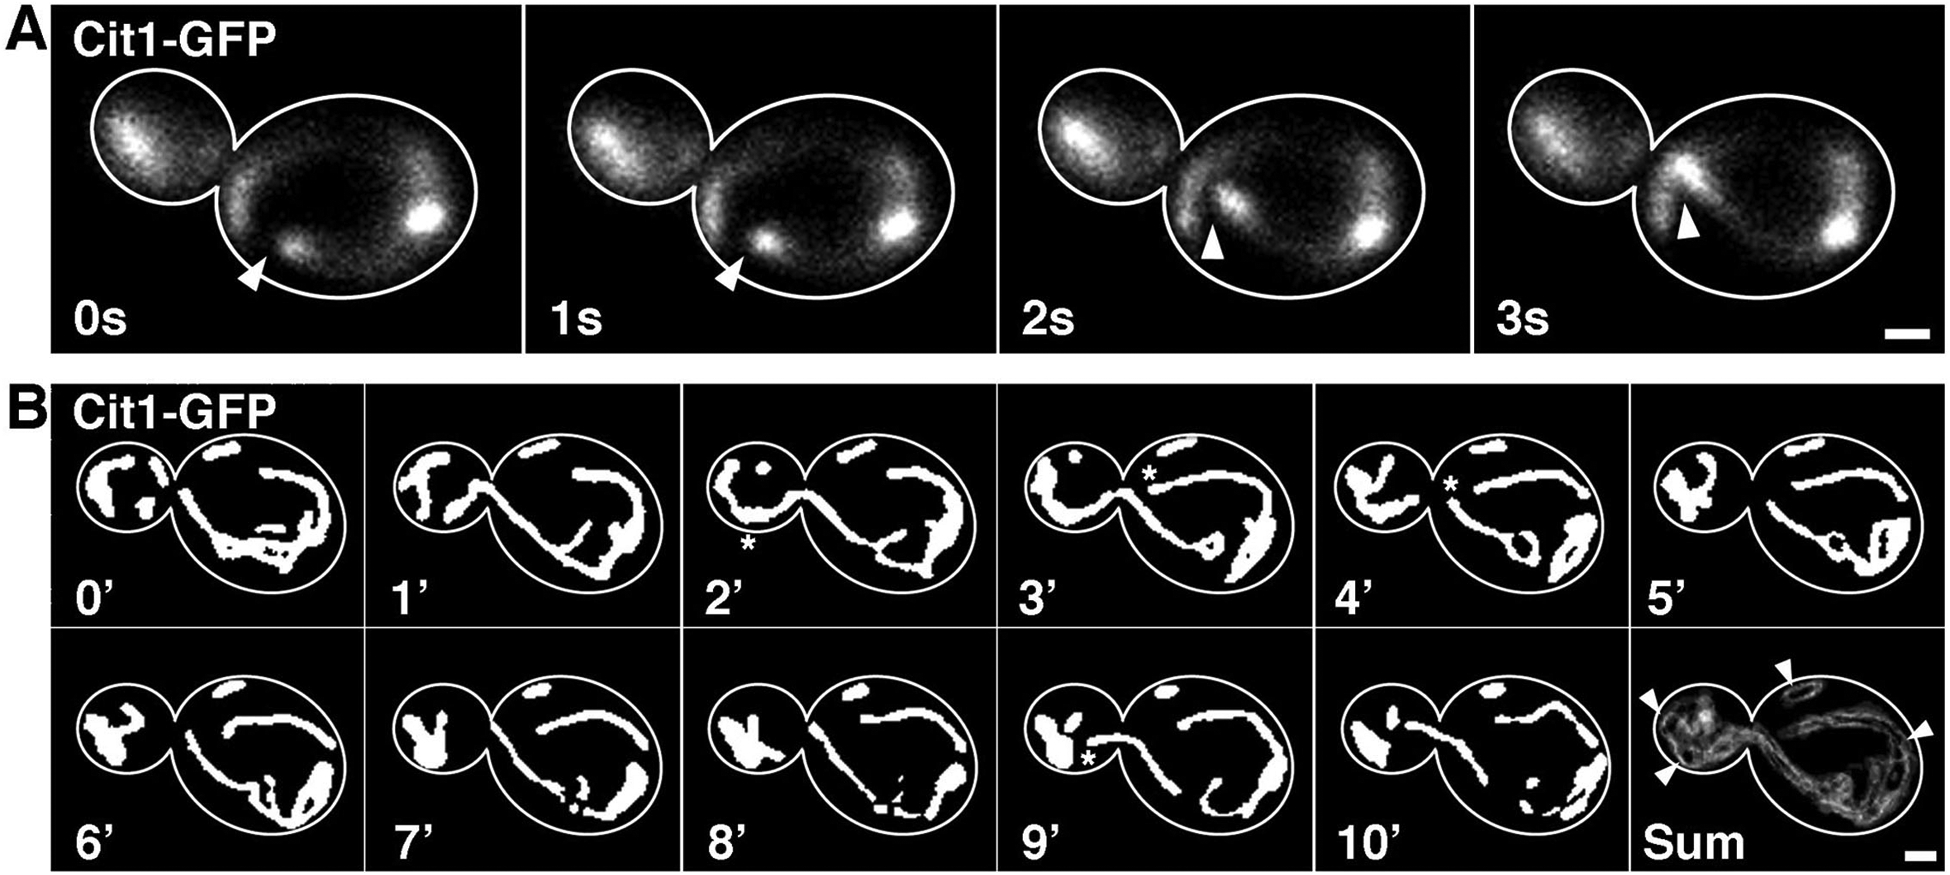
Fig. 2. Visualization of mitochondrial dynamics in budding yeast.

A) Velocity of mitochondrial motility was determined by taking single-plane images of Cit1-GFP every 1 s for 30 s. Images were captured using standard GFP filters and 100 ms exposure time. The optimal imaging plane is slightly above the center of the cell. Arrowheads follow the tip of a tubular mitochondrion moving in an anterograde direction. Scale bar = 1 μM. B) Total motility of mitochondria was determined by taking z-stacks of Cit1-GFP every 30 s for 10 min. Images were captured using a standard GFP filter, a 50% neutral density filters, and 100 ms exposure time. Thresholded maximum-intensity projections at 1-min intervals are shown. Stars indicate the largest movement events that were visualized during the 10 minute period. The “Sum” image (bottom-right corner) is the sum of the difference images calculated by the Total Motility plugin. This image depicts all motility events where white indicates movement and black mitochondrial centers indicate lack of movement. Edges of mitochondria commonly appear grey due to small non-directed movements. Arrowheads mark mitochondrial anchorage sites in the bud tip, mother tip, and mother cortex where mitochondrial movement is completely lacking. Scale bar = 1 μM.
