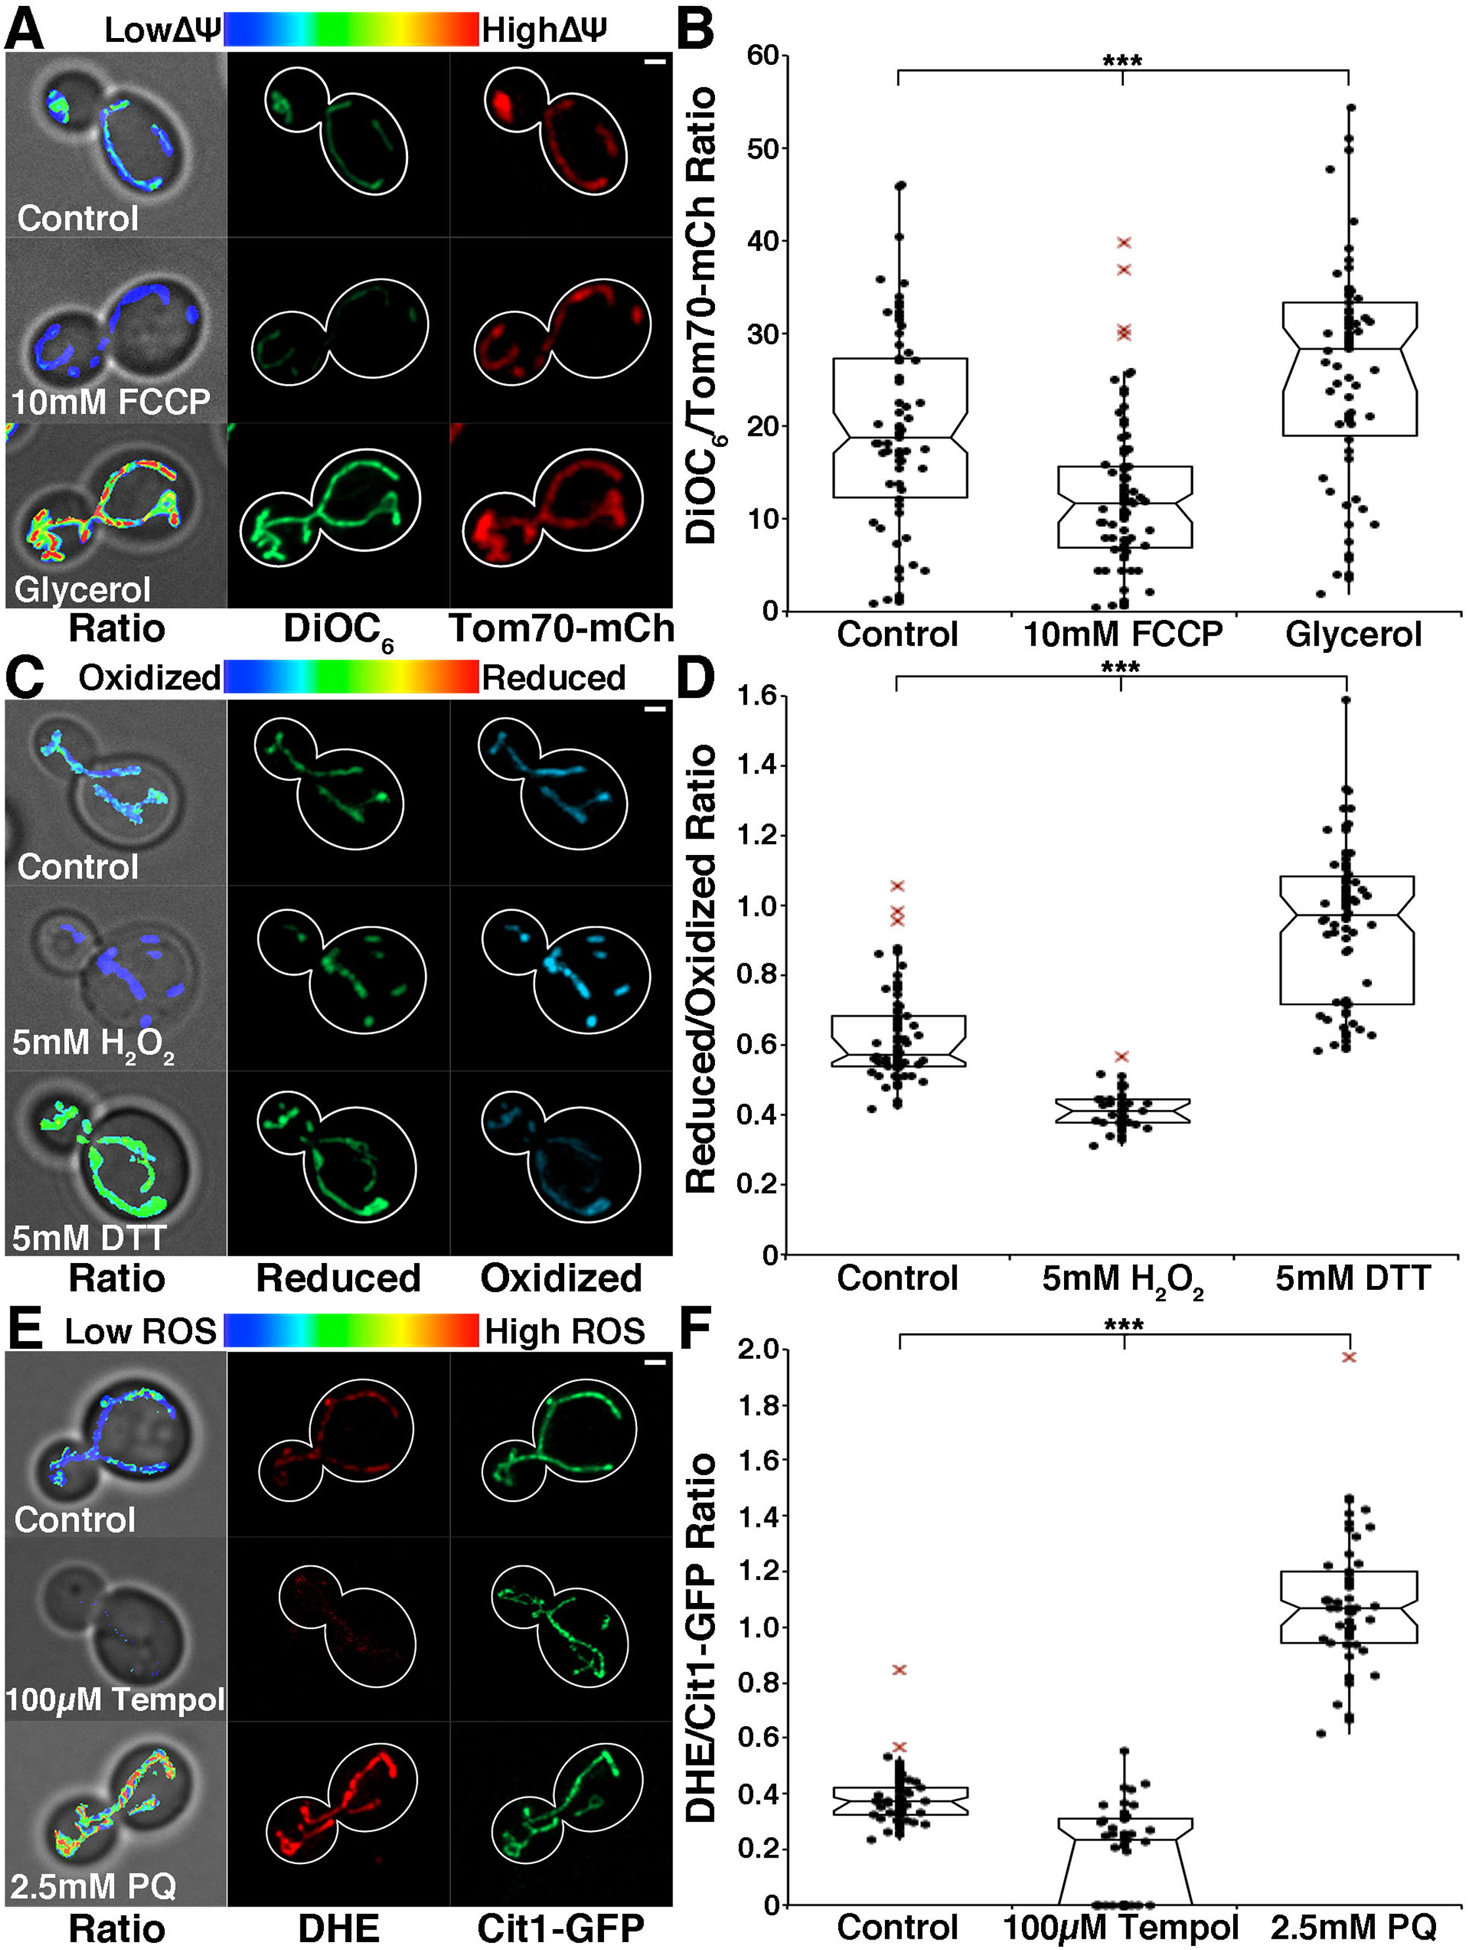
Fig. 3. Characterization of mitochondrial quality.

A) DiOC6 was used to visualize mitochondrial membrane potential in wild-type cells. Images were acquired using a 470 nm LED at 100% power, 50 ms exposure time and standard GFP filters for DiOC6 and 200 ms exposure time and metal-halide lamp with standard DsRed filters for Tom70-mCherry. Left panels: DiOC6:Tom70-mCherry ratios overlaid on bright-field images. Color scale indicates ratio values; higher numbers and warmer colors indicate higher membrane potential. Middle panels: DiOC6 images. Right panels: Tom70-mCherry images. Cell outlines were drawn from brightfield images. Scale bar = 1 μM. B) Notched dot box plot of the average DiOC6:Tom70-mCherry ratio in wild-type cells grown in glucose, 10 mM FCCP, and glycerol. Cells were treated with FCCP for 15 minutes prior to addition of DiOC6 or grown in YPG overnight and allowed to recover in SC with glucose for 3 hrs. n = 50 cells for each strain. Data is representative of 3 experiments. *** = p-value < 0.001 using non-parametric Kruskal-Wallis testing with pairwise Bonferroni correction. C) Mito-roGFP was used to visualize the redox environment of mitochondria in wild-type cells. Left panels: reduced:oxidized roGFP ratios overlaid on phase images. Images were acquired using a standard GFP filter with excitation filter removed, and LED excitation at 365 nm (25% power) and 100 ms exposure for the oxidized channel and 470 nm (100% power) and 100 ms exposure for the reduced channel. Color scale indicates ratio values; higher numbers and warmer colors indicate more reducing mitochondria. Middle panels: reduced roGFP. Right panels: oxidized roGFP. Cell outlines were drawn from bright-field images. Scale bar = 1 μM. D) Notched dot box plot of the average reduced:oxidized mito-roGFP1 ratio in wild-type cells untreated and treated with 5 mM H2O2 and 5 mM DTT. Cells were treated with H2O2 or DTT for 30 min prior to imaging. n = 50 cells for each strain. Data is representative of 3 experiments. *** = p-value < 0.001 using non-parametric Kruskal-Wallis testing with pairwise Bonferroni correction. E) DHE was used to visualize mitochondrial ROS levels in wild-type cells. Left panels: DHE:Cit1-GFP ratios overlaid on bright-field images. Cells were stained with DHE at 40 μM for 30 min and imaged using a standard rhodamine filter and 100 ms exposure for DHE and a standard GFP filter and 100 ms exposure for Cit1-GFP. Color scale indicates ratio values; higher numbers and warmer colors indicate lower ROS levels. Middle panels: DHE. Right panels: Cit1-GFP. Cell outlines were drawn from bright-field images. Scale bar = 1 μM. F) Notched dot box plot of the average DHE:Cit1-GFP ratio in wild-type cells untreated and treated with 2.5 mM paraquat (PQ) and 100 μM Tempol. Cells were treated with PQ or Tempol for 30 min prior to addition of DHE. n = 50 cells for each strain. Data is representative of 2 experiments. *** = p-value < 0.001 using non-parametric Kruskal-Wallis testing with pairwise Bonferroni correction.
