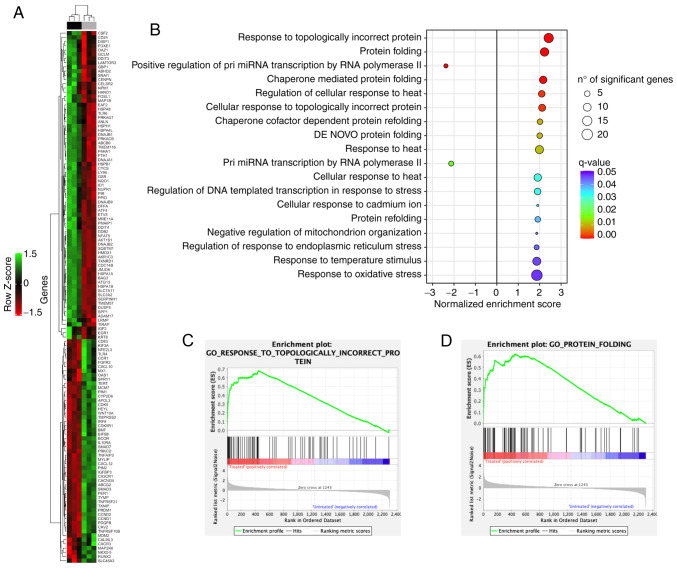
Figure 4.
Changes in the expression of cancer-related genes in response to tomentosin treatment in RPMI-8226 cells. (A) Heatmap showing the 126 differentially expressed genes after tomentosin treatment. Upper color bar represents sample classes; black represents treated sample group (8 h treatment, 25 µM); grey represents untreated sample group (cells treated with vehicle solution). (B) Gene sets enriched by tomentosin treatment (false discovery rate <0.05). Positive NES indicates upregulated gene sets; negative NES indicates downregulated gene sets. (C and D) Gene Set Enrichment Analysis plots showing upregulation of 'Response to Topologically Incorrect Protein' pathway and 'Protein Folding' pathway. NES, normalized enrichment score.

