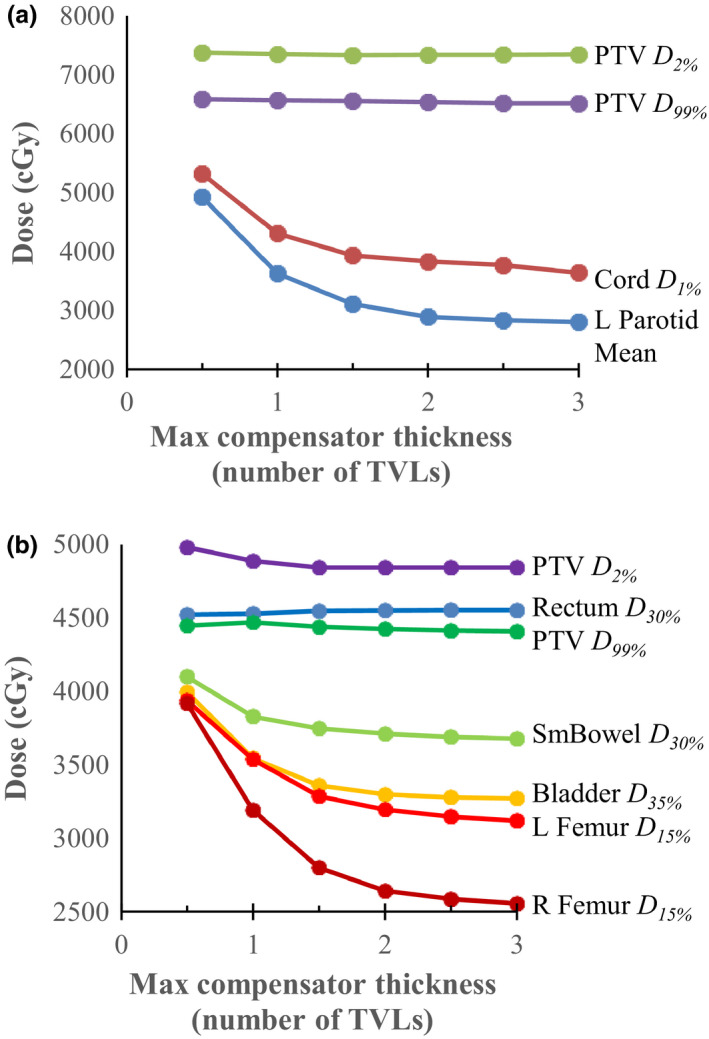
Figure 7.

Dosimetric endpoints for a head‐and‐neck plan (top) and a gynecological plan (bottom) as a function of the maximum allowed compensator thickness (quoted in number of tenth‐value layers). For both cases the PTV D 2% and D 99% did not change as a function of maximum compensator thickness; however, the OAR doses decrease as the thickness increases. [Color figure can be viewed at wileyonlinelibrary.com]
