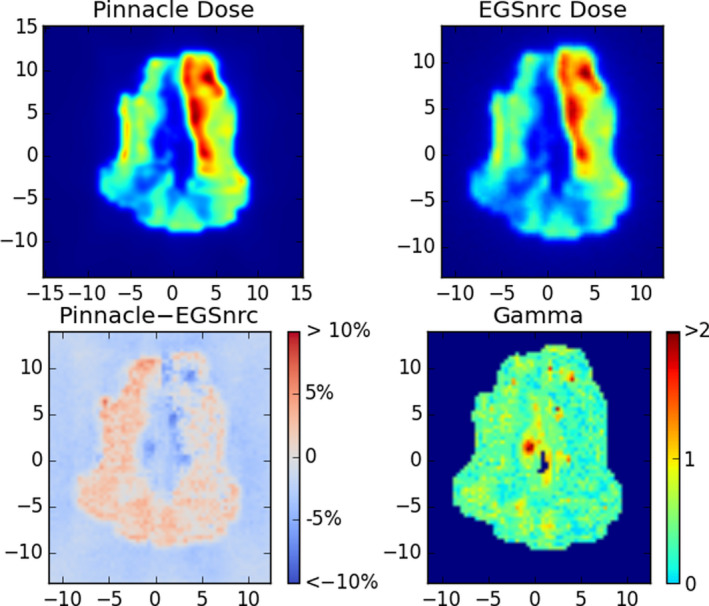
Figure 8.

Example Monte Carlo validation of one compensator IMRT field for a head‐and‐neck case. Top: the dose planes in water extracted from Pinnacle and from the EGSnrc validation simulation. Bottom: the difference in dose as a percentage of maximum dose (left) and a map of gamma values (right) with criteria 3% and 3 mm, with a 10% threshold. In this case the pass rate was 97%. [Color figure can be viewed at wileyonlinelibrary.com]
