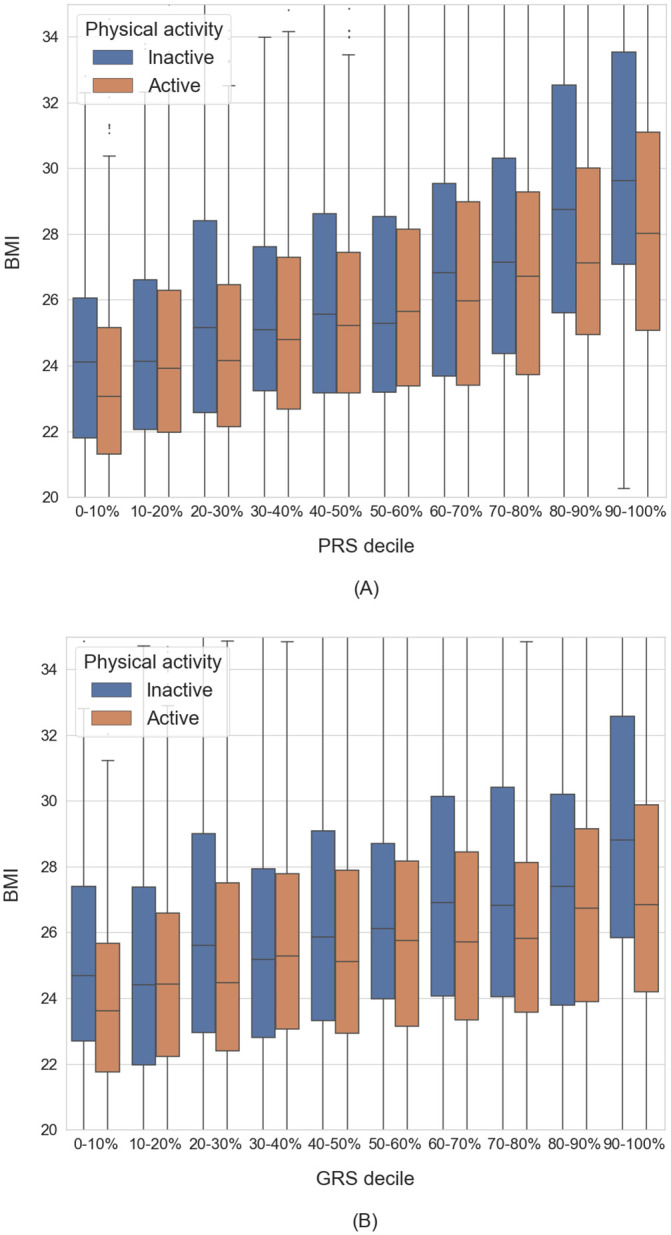
Fig 3. BMI distribution of individuals, stratified by genetic risk and levels of physical activity.

(A): Individuals stratified by BMI PRS deciles. (B): Individuals stratified by BMI GRS deciles. Both graphs are plotted in the same scale and cut at 10th / 90th percentiles on the y-axis. Box plots represent the median and 25th / 75th percentiles. Whiskers are set at 1.5 IQR. Both graphs show BMI, unadjusted for age and sex. Adjusted BMI residuals and outliers are available at Online Supplementary.
